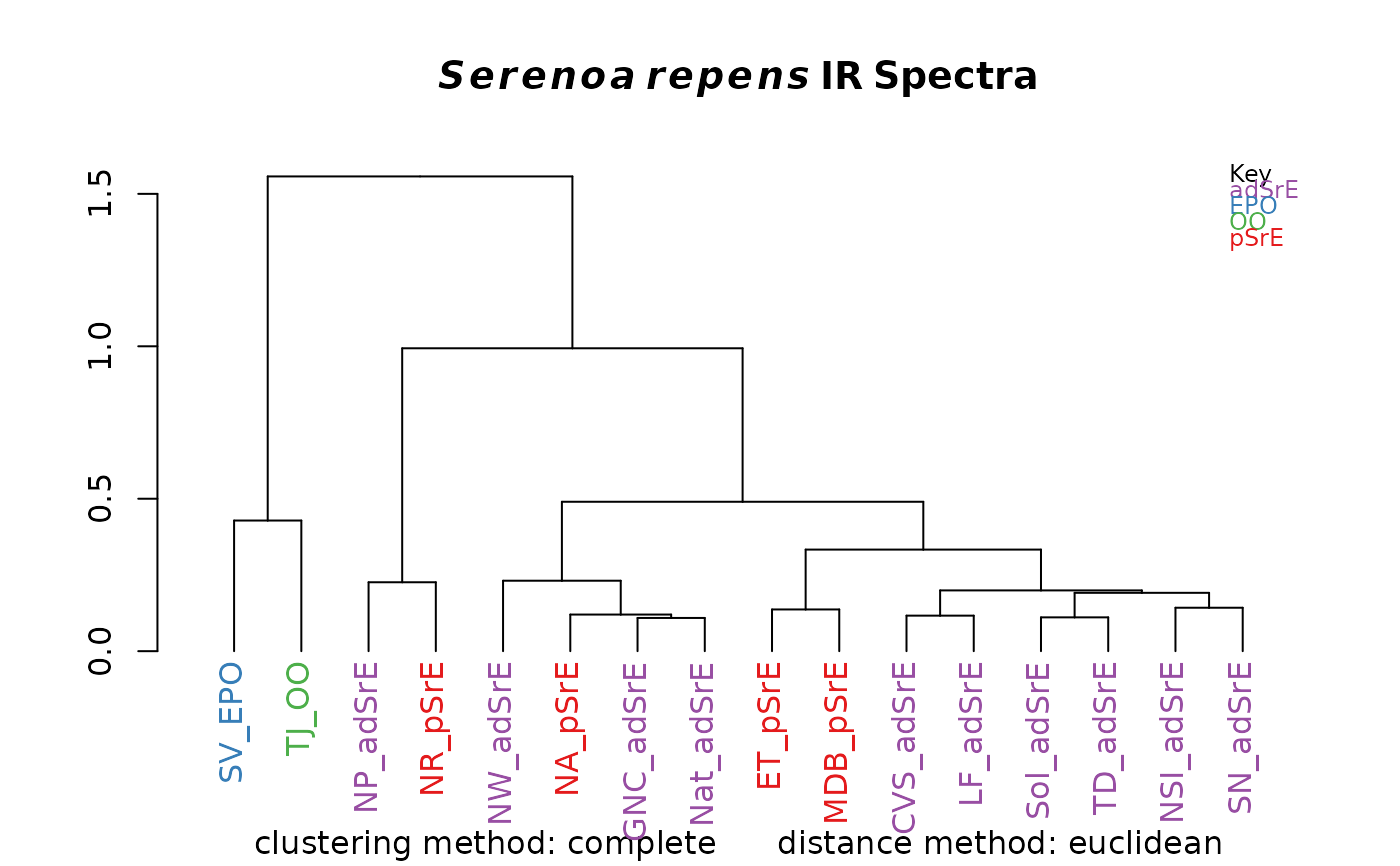
A wrapper which carries out HCA and plots a dendrogram colored by the
information in a Spectra object. Many methods for computing
the clusters and distances are available.
hcaSpectra(
  spectra,
  c.method = "complete",
  d.method = "euclidean",
  use.sym = FALSE,
  leg.loc = "topright",
  ...
)
Arguments
- spectra
An object of S3 class
Spectra().- c.method
A character string describing the clustering method; must be acceptable to
hclust.- d.method
A character string describing the distance calculation method; must be acceptable as a method in
rowDist.- use.sym
A logical; if true, use no color and use lower-case letters to indicate group membership.
- leg.loc
Character; if
"none"no legend will be drawn. Otherwise, any string acceptable tolegend.- ...
Other parameters to be passed to the plotting functions.
Value
A list, containing an object of class hclust and an
object of class dendrogram. The side effect is a plot.
See also
hclust for the underlying function.
hcaScores for similar analysis of PCA scores from a
Spectra object. Additional documentation at
https://bryanhanson.github.io/ChemoSpec/
Examples
# You need to install package "amap" for this example
if (requireNamespace("amap", quietly = TRUE)) {
  data(SrE.IR)
  myt <- expression(bolditalic(Serenoa) ~ bolditalic(repens) ~ bold(IR ~ Spectra))
  res <- hcaSpectra(SrE.IR, main = myt)
}