Plot the Distance Between Spectra and a Reference Spectrum in a Spectra Object
Source:R/plotSpectraDist.R
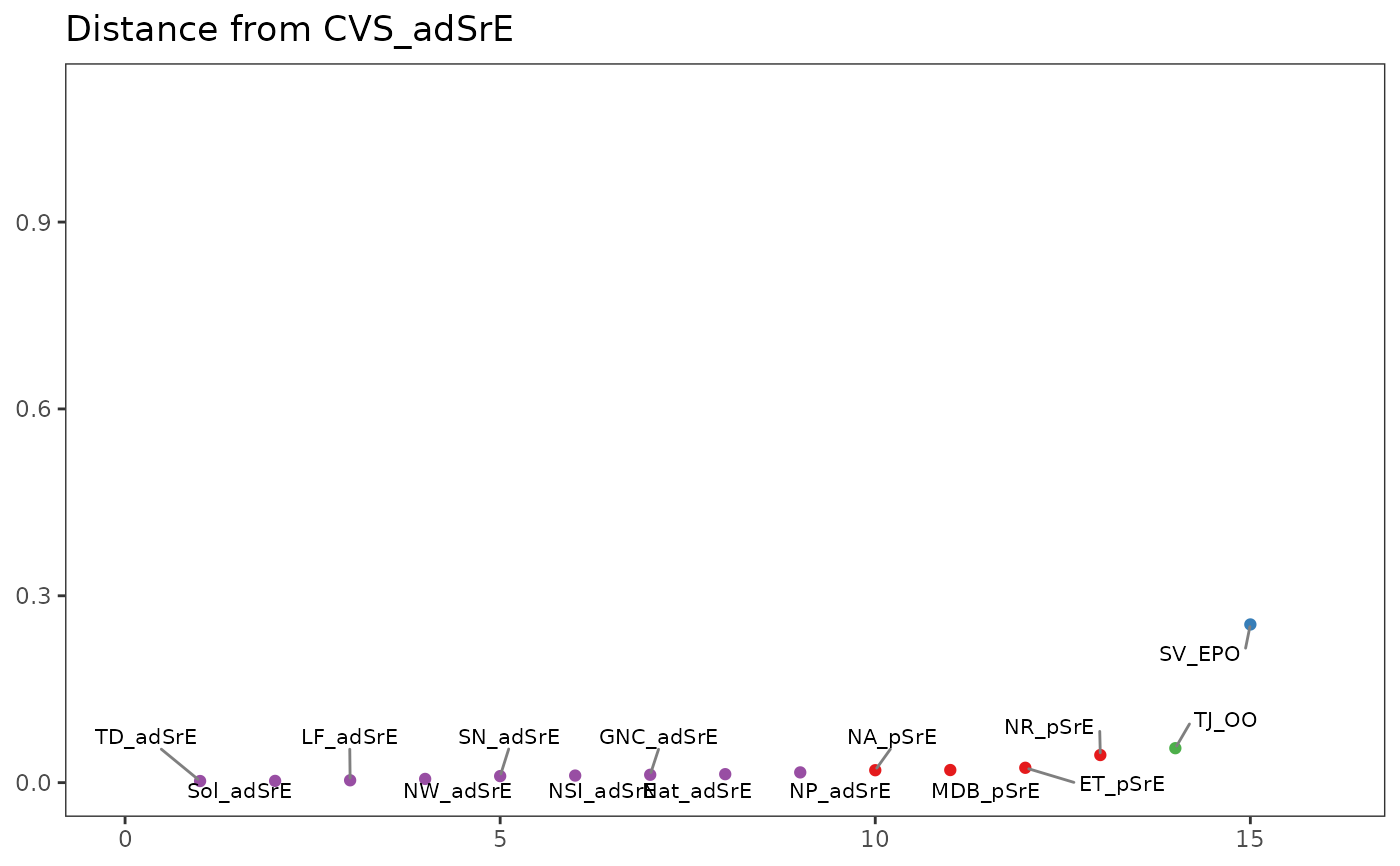
plotSpectraDist.RdThis function plots the distance between a reference spectrum and all other
spectra in a Spectra object. Distance can be defined in a number of
ways (see Arguments).
plotSpectraDist(spectra, method = "pearson", ref = 1, labels = TRUE, ...)Arguments
Value
The returned value depends on the graphics option selected (see ChemoSpecUtils::GraphicsOptions()).
base A data frame or list containing the data plotted. Assign the value and run
str()ornames()on it to see what it contains. Side effect is a plot.ggplot2 The plot is displayed, and a
ggplot2plot object is returned if the value is assigned. The plot can be modified in the usualggplot2manner. If you want the plotted values, you can access them via the base graphics mode.
See also
To compare all spectra simultaneously in a heatmap, see
sampleDist. Additional documentation
at https://bryanhanson.github.io/ChemoSpec/
Examples
# You need to install package "amap" to use this function
if (requireNamespace("amap", quietly = TRUE)) {
  # This example assumes the graphics output is set to ggplot2 (see ?GraphicsOptions).
  library("ggplot2")
  data(SrE.NMR)
  txt1 <- paste("Distance from", SrE.NMR$names[1])
  txt2 <- paste("Rank Distance from", SrE.NMR$names[1])
  p <- plotSpectraDist(SrE.NMR)
  p <- p + labs(title = txt1, xlab = txt2, ylab = txt2) +
    coord_cartesian(ylim = c(0, 1.1), xlim = c(0, 16))
  p
}