Utility to review all spectra in a Spectra object. Output depends upon the graphics
output choice.
- base:
Plots each spectrum one at a time, and waits for a return in the console before plotting the next spectrum. Use
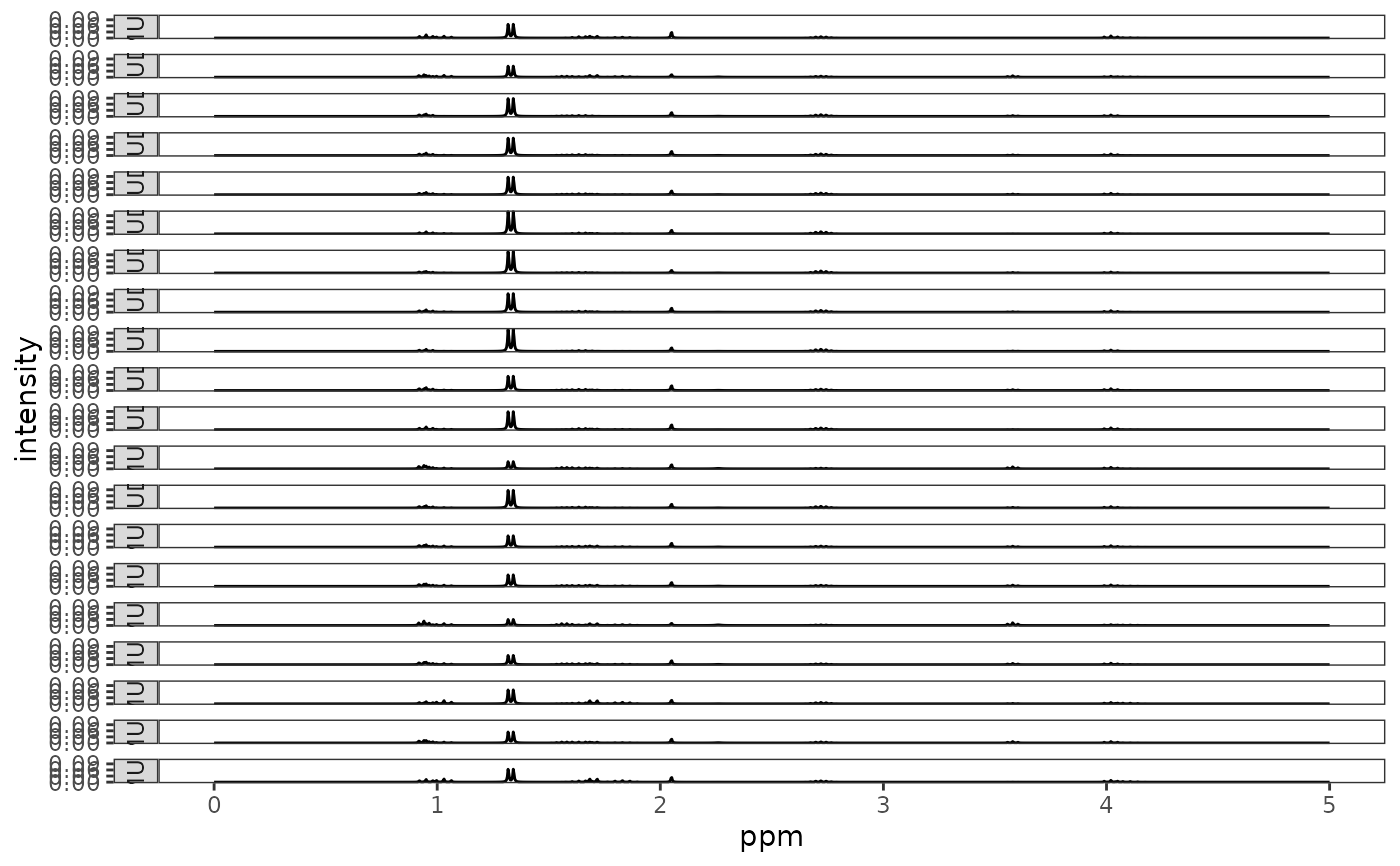
ESCto get out of the loop.- ggplot2:
All the spectra are plotted in a single column.
reviewAllSpectra(spectra, ...)Arguments
- spectra
An object of S3 class
Spectra().- ...
Parameters to be passed to the plotting routines. Applies to base graphics only.
Value
The returned value depends on the graphics option selected (see ChemoSpecUtils::GraphicsOptions()).
base: None. Side effect is a plot.ggplot2: The plot is displayed, and aggplot2object is returned if the value is assigned. The plot can be modified in the usualggplot2manner.
See also
See ChemoSpecUtils::GraphicsOptions()
for more information about the graphics options. Additional documentation at
https://bryanhanson.github.io/ChemoSpec/
Examples
# Because there are 16 spectra in this data set, you probably want to
# expand the height of the graphics device to see the spectra clearly.
# This example assumes the graphics output is set to ggplot2 or plotly (see ?GraphicsOptions).
# If you do options(ChemoSpecGraphics == "plotly") you'll get the results
# in a web page, which is particularly convenient.
library("ggplot2")
data(metMUD1)
p <- reviewAllSpectra(metMUD1)
p