Plot Measures of Central Tendency and Spread for a Spectra Object
Source:R/surveySpectra.R, R/surveySpectra2.R
surveySpectra.RdCompute and plot various measures of central tendency and
spread for a Spectra object. Several different measures/spreads
are available. These are useful as an overview of where a data set varies
the most.
Arguments
- spectra
An object of S3 class
Spectra().- method
Character. One of
c("sd", "sem", "sem95", "mad", "iqr").- by.gr
Logical, indicating if the analysis is to be done by group or not. Applies to
surveySpectraonly.- ...
Parameters to be passed to the plotting routines. Applies to base graphics only.
- lab.pos
Numeric, giving the frequency where the label should be drawn. Applies to
surveySpectra2only.
Value
The returned value depends on the graphics option selected (see ChemoSpecUtils::GraphicsOptions()).
base: None. Side effect is a plot.ggplot2: The plot is displayed, and aggplot2object is returned if the value is assigned. The plot can be modified in the usualggplot2manner.
Details
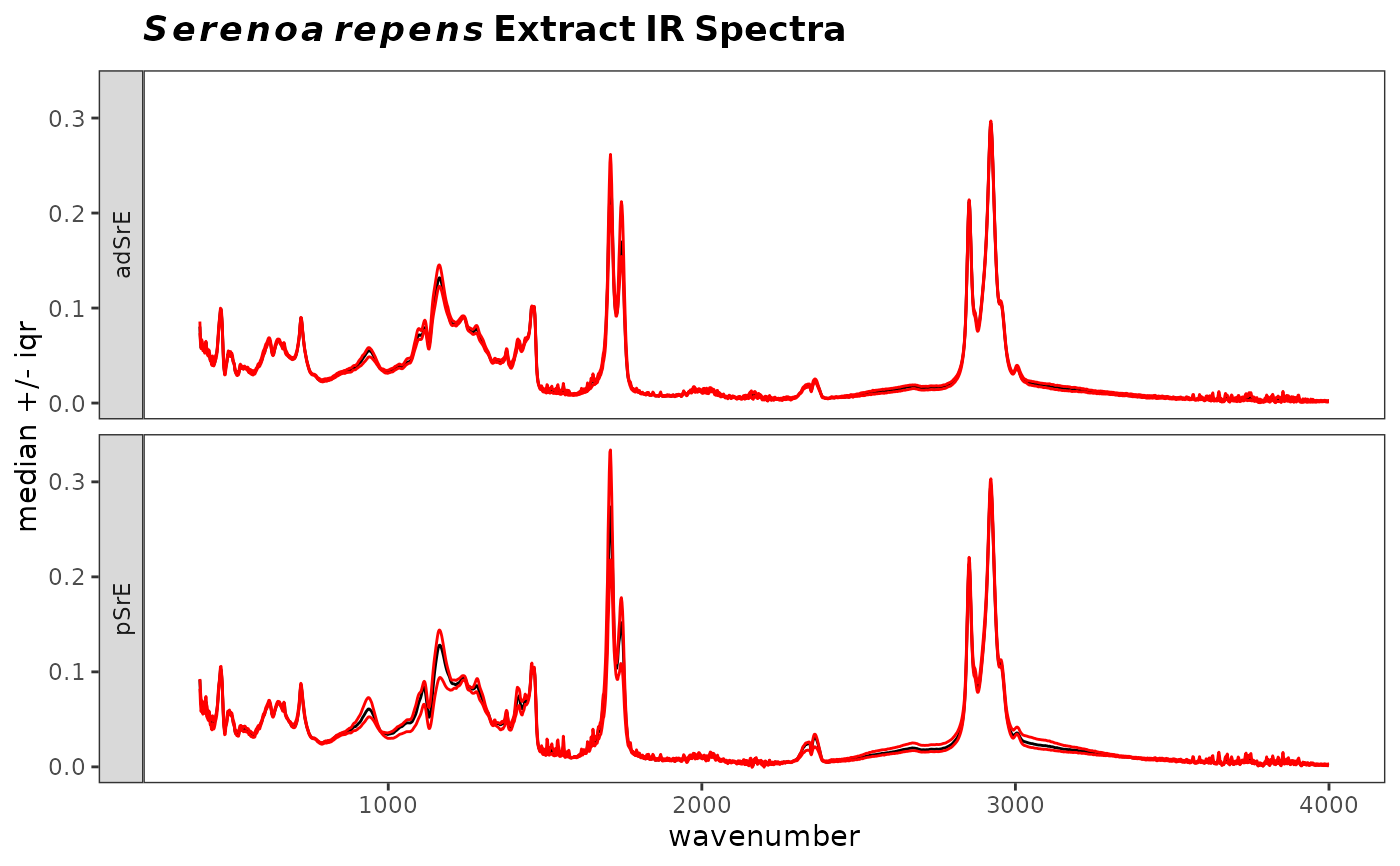
For surveySpectra the method choice works as follows: sd plots
the mean spectrum +/- the standard deviation, sem plots the mean
spectrum +/- the standard error of the mean, sem95 plots the mean
spectrum +/- the standard error at the 95 percent confidence interval,
mad plots the median spectrum +/- the median absolute deviation, and
finally, iqr plots the median spectrum + the upper hinge and - the
lower hinge.
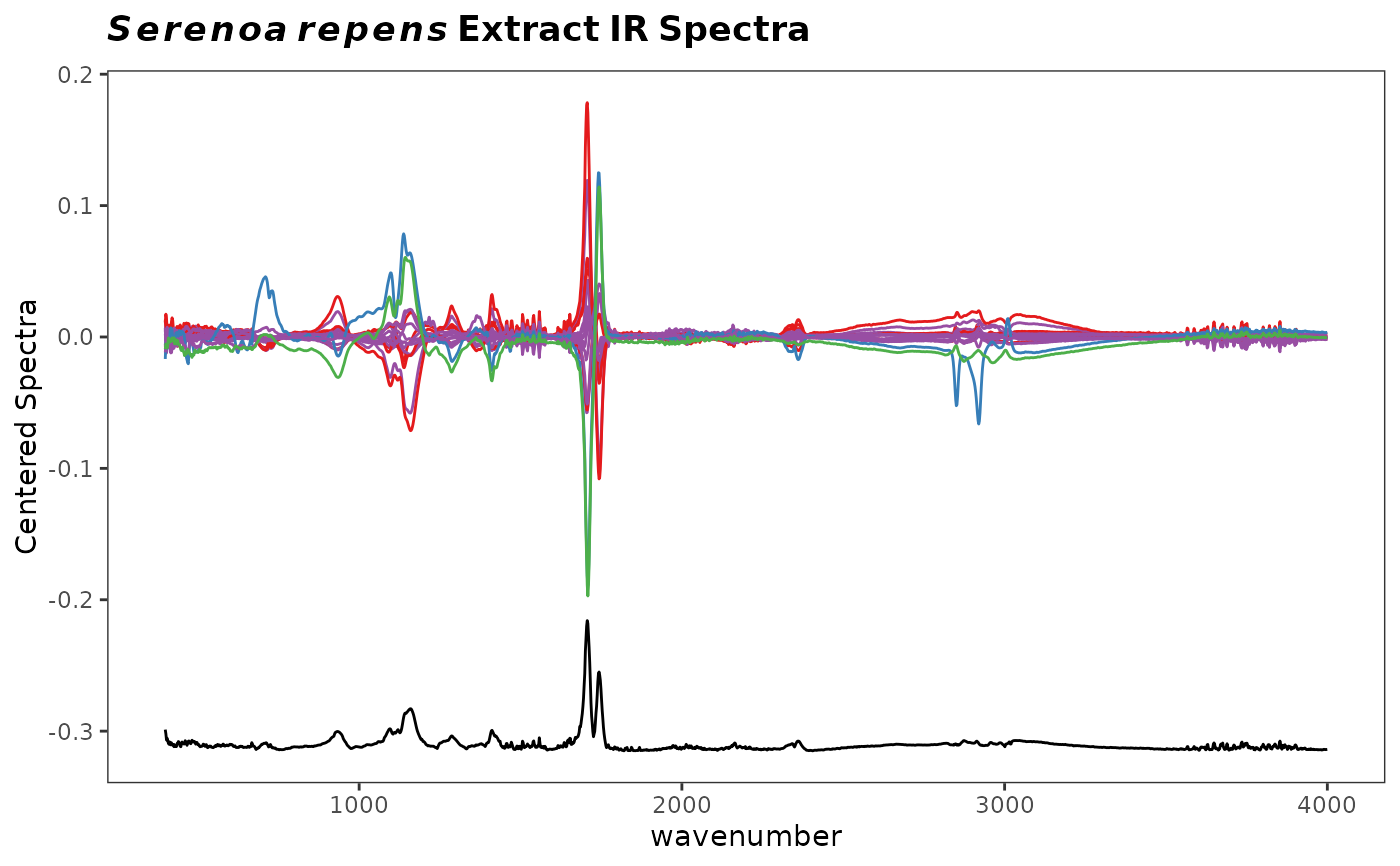
For surveySpectra2, the spectra are mean centered and plotted. Below
that, the relative summary statistic is plotted, offset, but on the same
scale.
Functions
surveySpectra(): Spectral survey emphasizing mean or median spectrum, optionally by group.surveySpectra2(): Spectral survey emphasizing variation among spectra.
See also
Additional documentation at https://bryanhanson.github.io/ChemoSpec/
Examples
# This example assumes the graphics output is set to ggplot2 (see ?GraphicsOptions).
library("ggplot2")
data(SrE.IR)
myt <- expression(bolditalic(Serenoa) ~ bolditalic(repens) ~ bold(Extract ~ IR ~ Spectra))

p1 <- surveySpectra(SrE.IR, method = "iqr")
#>
#> Group EPO has 3 or fewer members
#>  so your stats are not very useful...
#>  This group has been dropped for display purposes!
#>
#> Group OO has 3 or fewer members
#>  so your stats are not very useful...
#>  This group has been dropped for display purposes!
p1 <- p1 + ggtitle(myt)
p1


p2 <- surveySpectra2(SrE.IR, method = "iqr")
p2 <- p2 + ggtitle(myt)
p2
p2 <- surveySpectra2(SrE.IR, method = "iqr")
p2 <- p2 + ggtitle(myt)
p2