Given a matrix or vector input, this function will assist in selecting levels for preparing
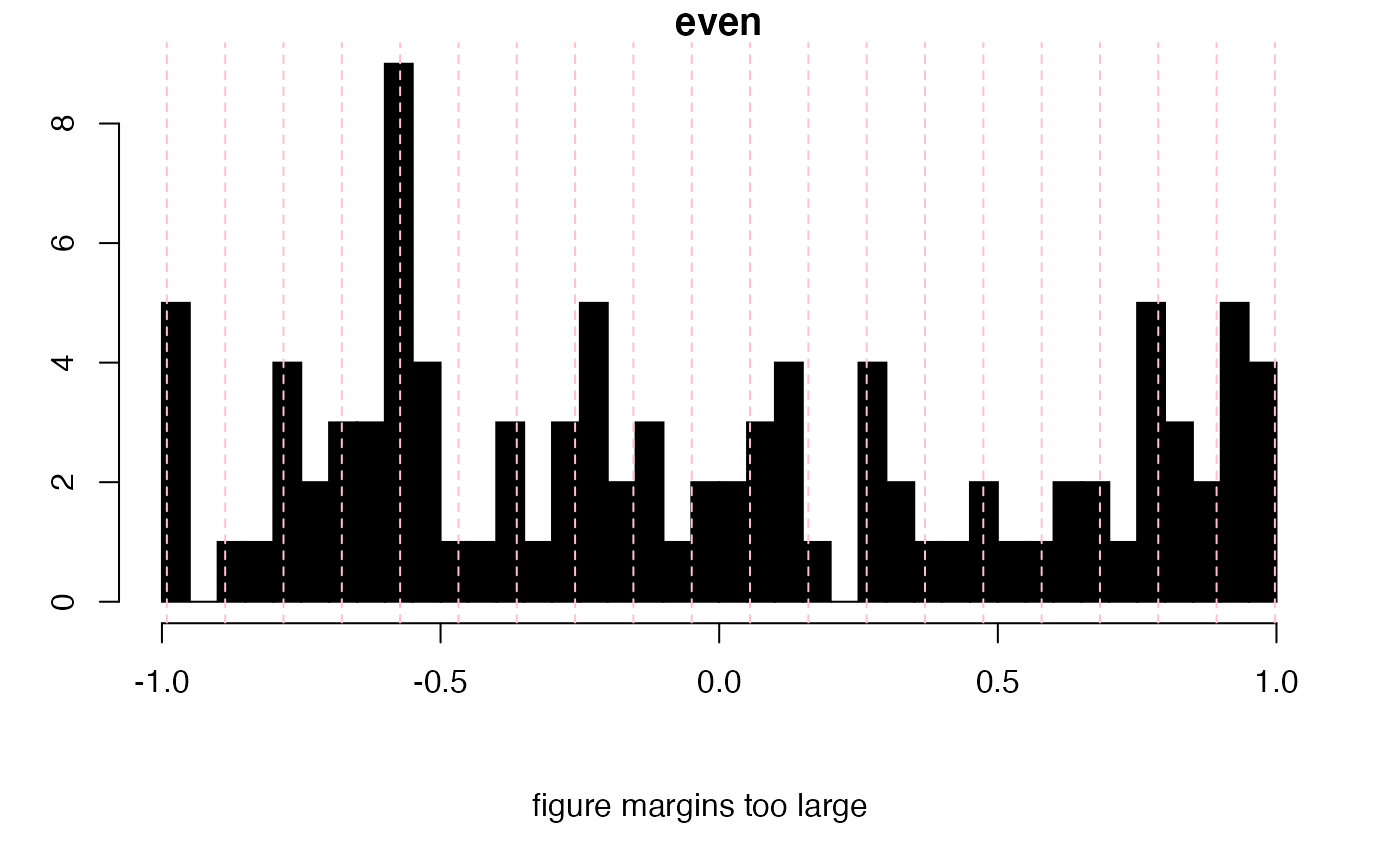
contour and image type plots. For instance, levels can be spaced evenly,
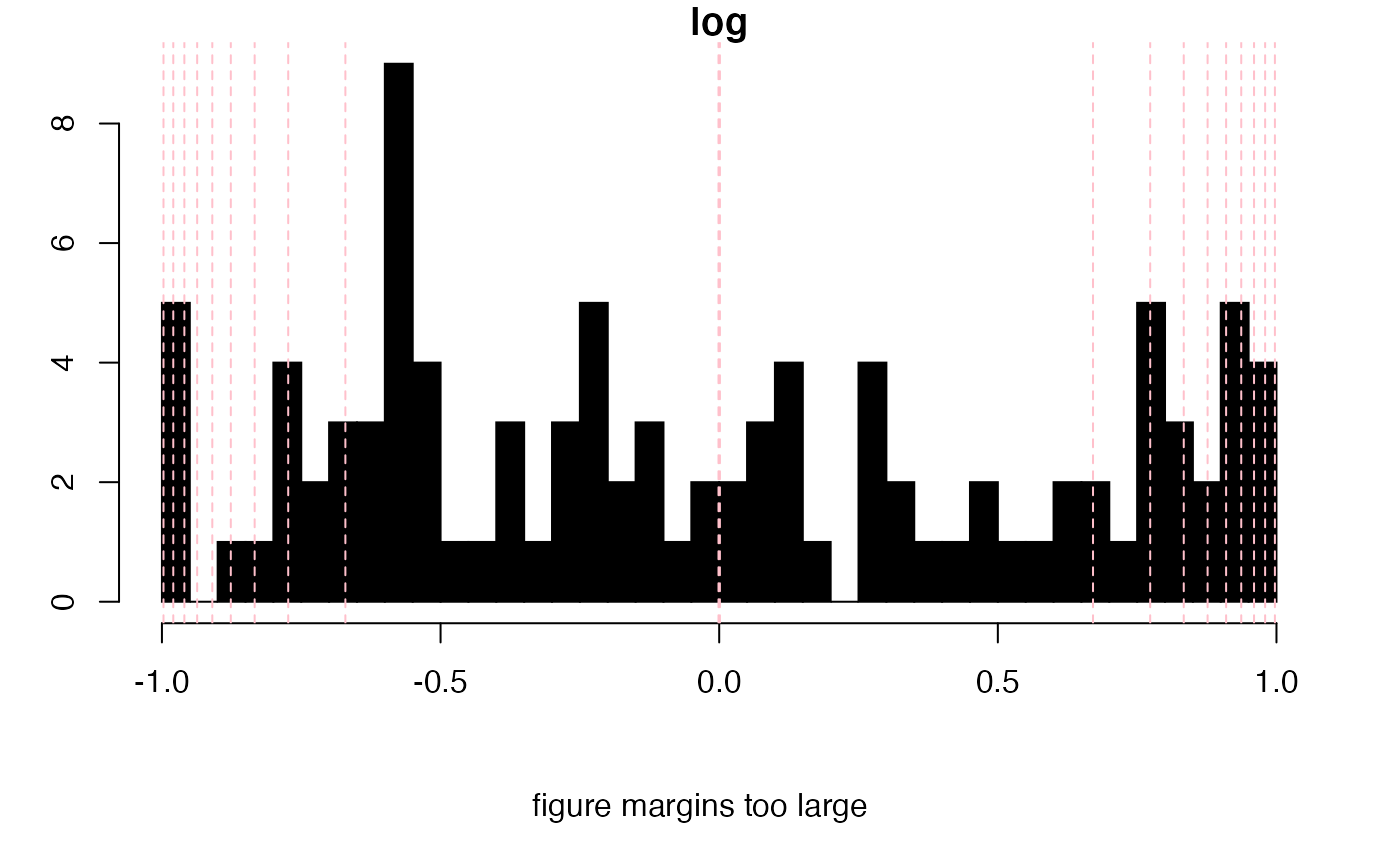
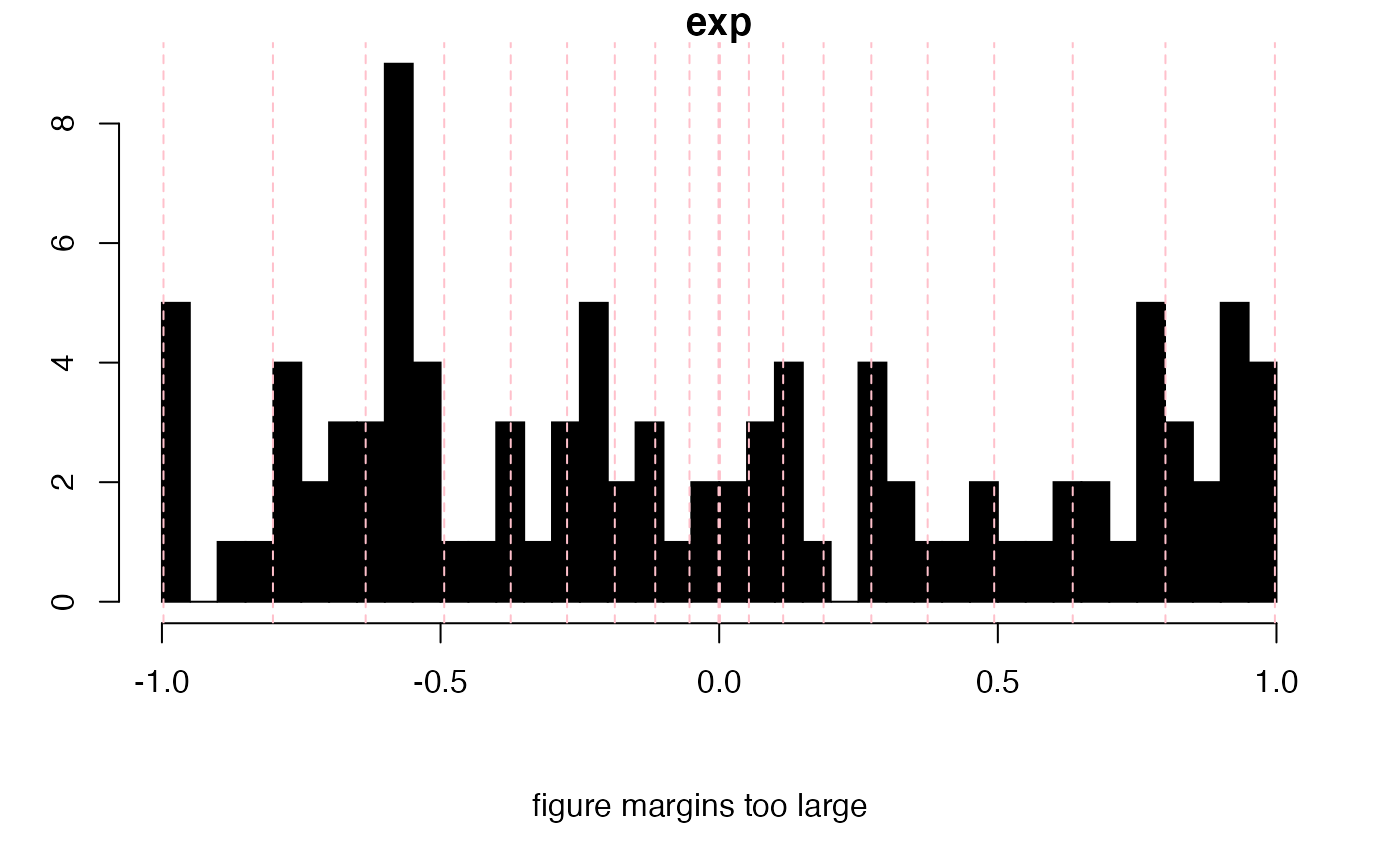
logrithmically, exponentially or using a cumulative distribution function.
NA values are ignored.
calcLvls(
  M,
  n = 10,
  mode = "even",
  lambda = 1.5,
  base = 2,
  showHist = FALSE,
  ...
)
Arguments
- M
A numeric matrix or vector.
- n
An integer giving the number of levels desired:
For
mode = "even"nevenly spaced levels are returned.For
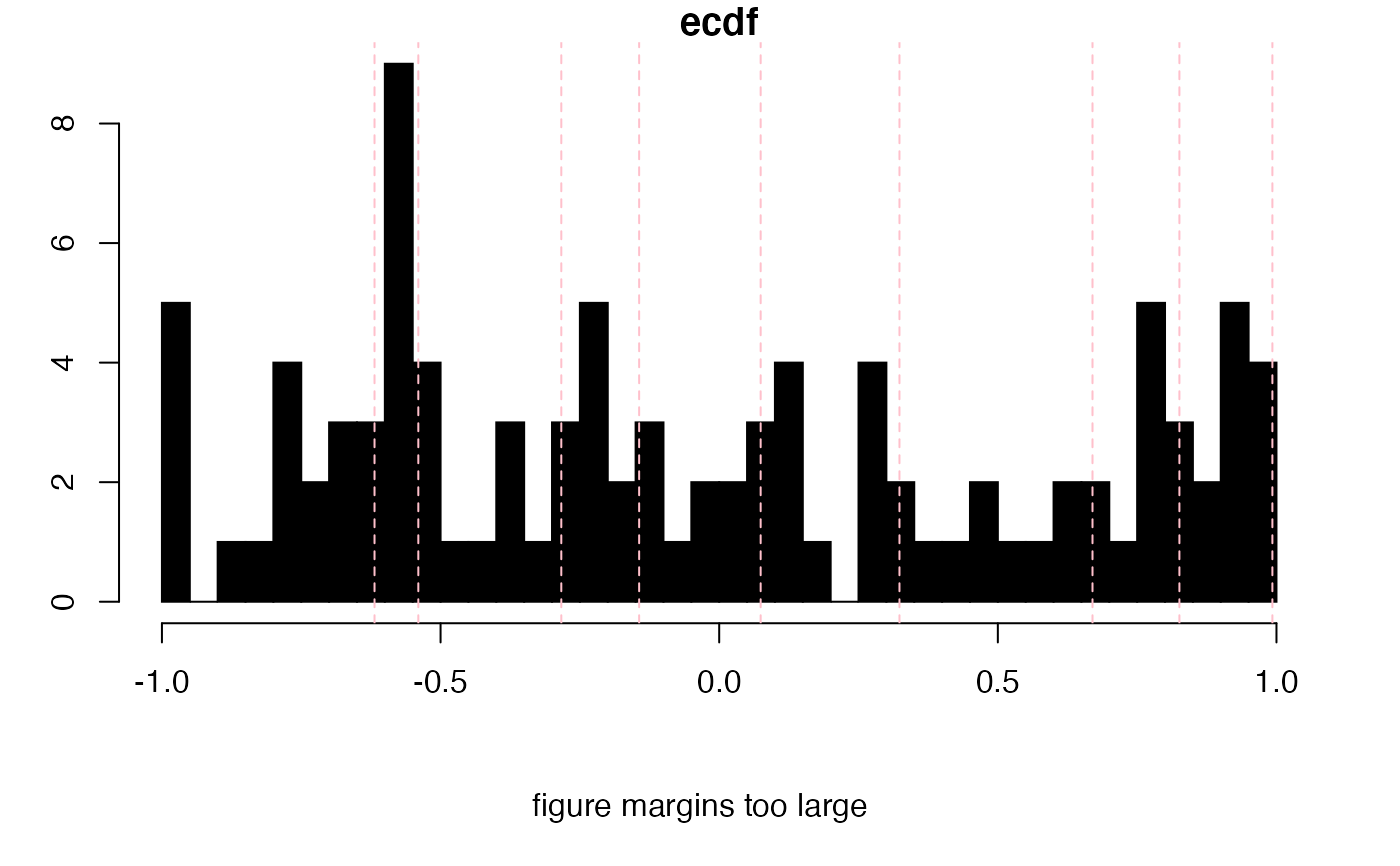
mode = "ecdf",nshould be one or more values in the interval [0...1]. For instance, a value of 0.6 corresponds to a single level in which 60 percent of the matrix values are below, and 40 percent above.For all other values of
mode,nis used internally asfloor(n/2)and the result eventually doubled in order to give a symmetric set of levels. In addition, only the positive or negative levels may be selected, leaving you withfloor(n/2)/2levels.
- mode
Character. One of
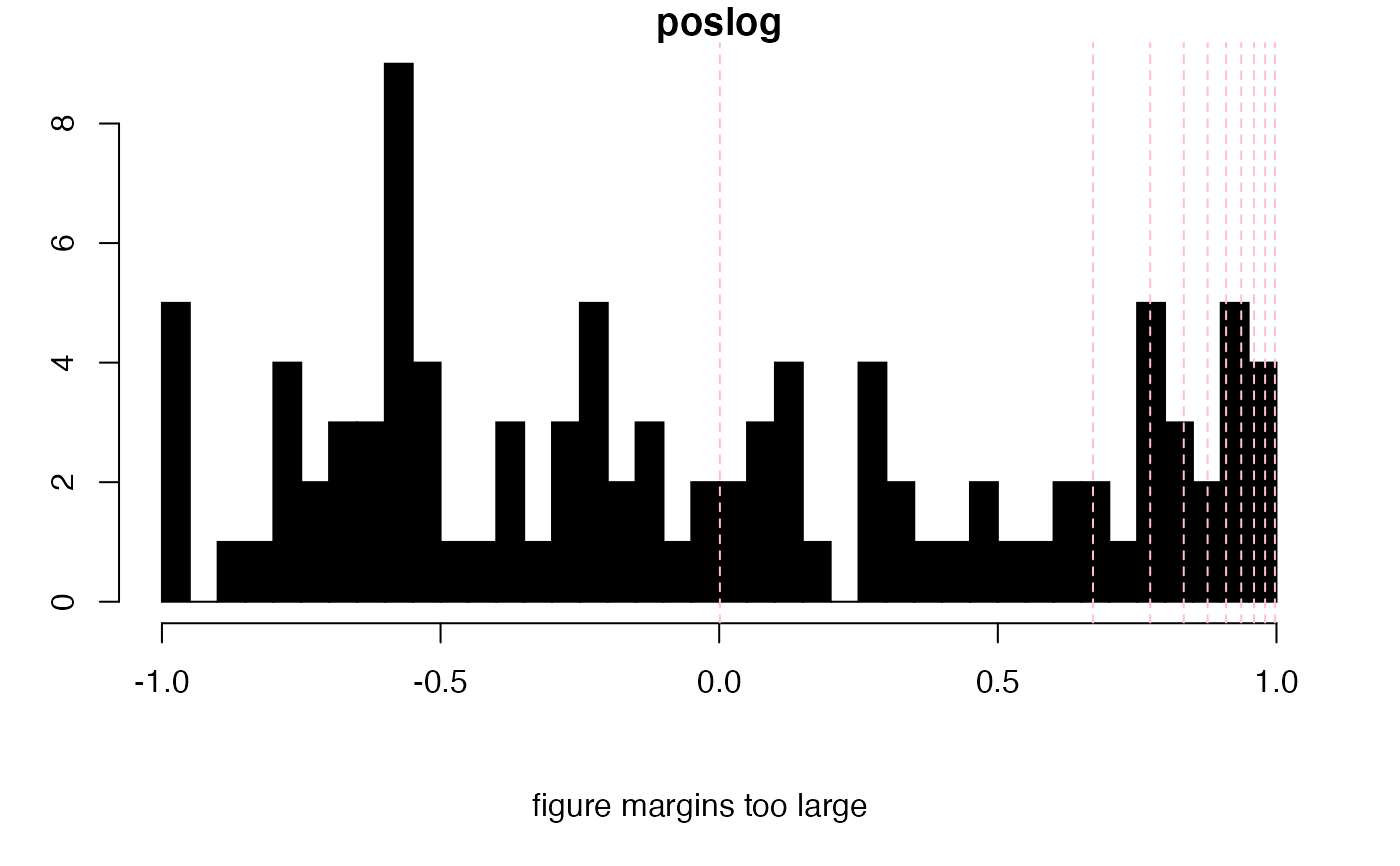
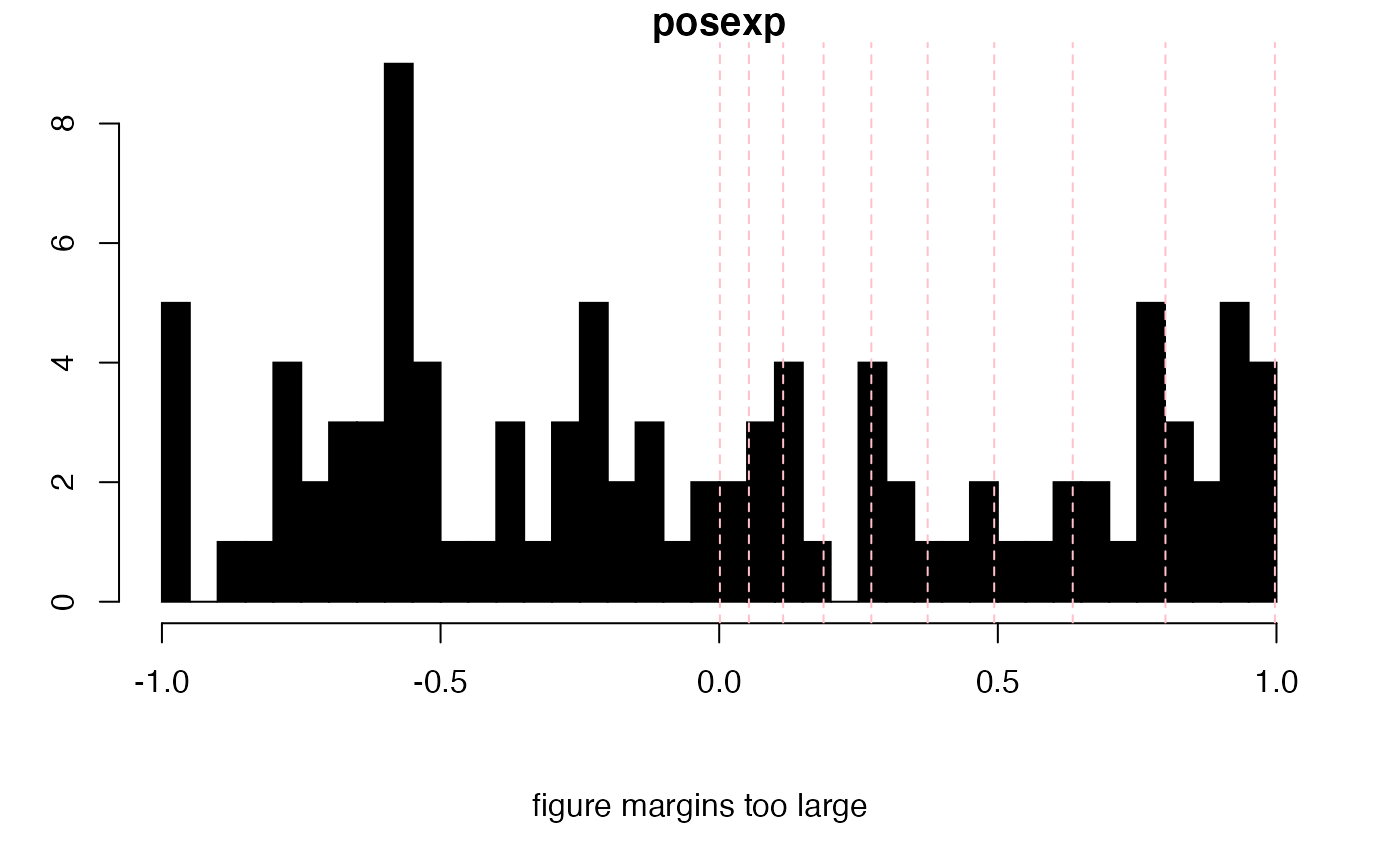
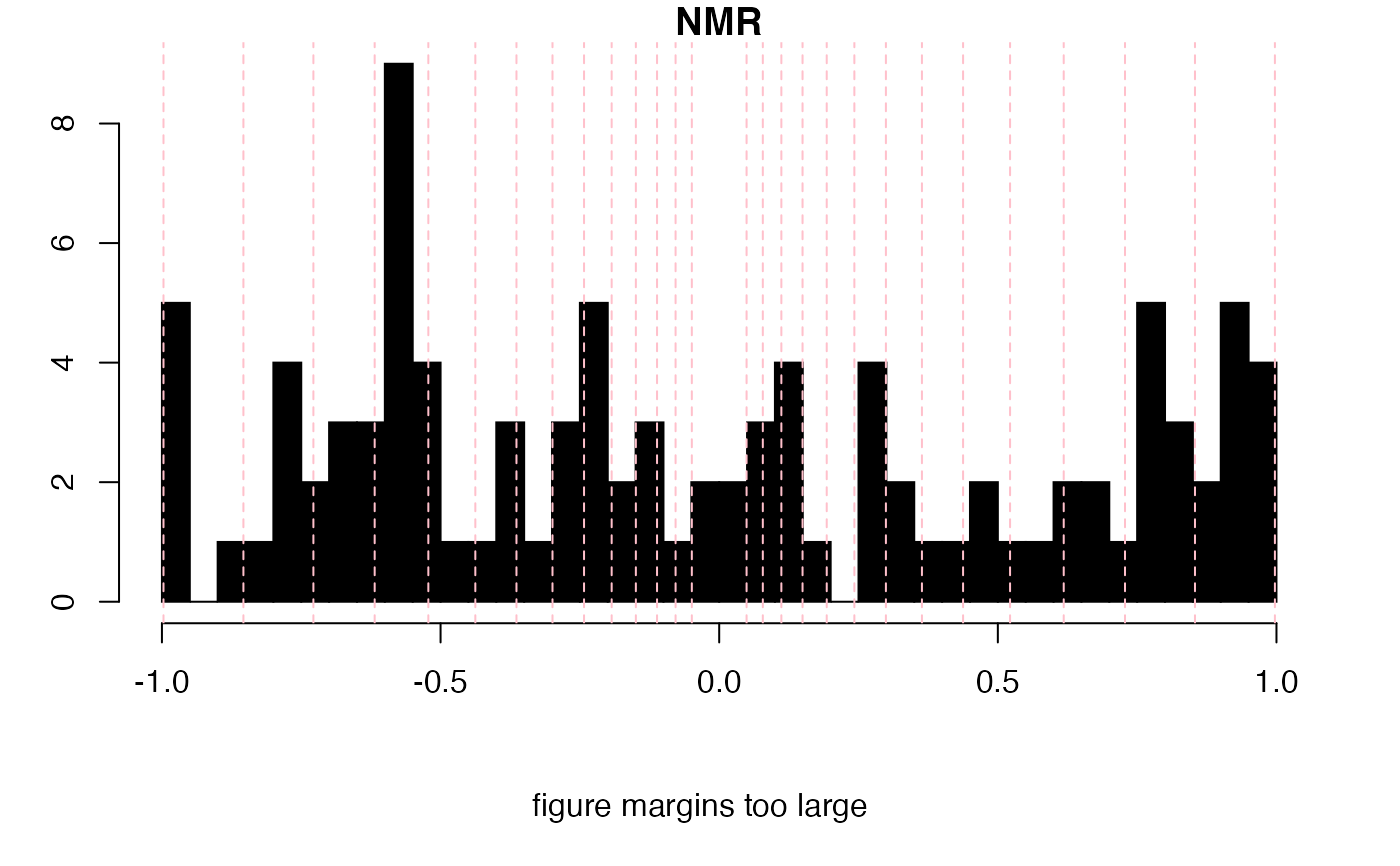
"even","log","exp","ecdf","posexp","negexp","poslog","neglog"orNMR."even"will create evenly spaced levels."log"will create levels which are more closely spaced at the high values, while"exp"does the opposite. The pos- or neg- versions select just the positive or negative values."ecdf"computes levels at the requested quantiles of the matrix.NMRusesexp,lambda = 2.0andn = 32. It also removes the four values closest to zero, where the data may be primarily noise.- lambda
Numeric. A non-zero exponent used with
method = "exp"and relatives. Higher values push the levels toward zero.- base
Integer. The base used with
method = "log"and relatives.- showHist
Logical. Shall a histogram be drawn showing the location of the chosen levels?
- ...
Arguments to be passed downstream.
Value
A numeric vector giving the levels.
Examples
set.seed(9)
MM <- matrix(runif(100, -1, 1), nrow = 10) # test data
tsts <- c("even", "log", "poslog", "exp", "posexp", "ecdf", "NMR")
for (i in 1:length(tsts)) {
  nl <- 20
  if (tsts[i] == "ecdf") nl <- seq(0.1, 0.9, 0.1)
  levels <- calcLvls(
    M = MM, n = nl, mode = tsts[i],
    showHist = TRUE, main = tsts[i]
  )
}
