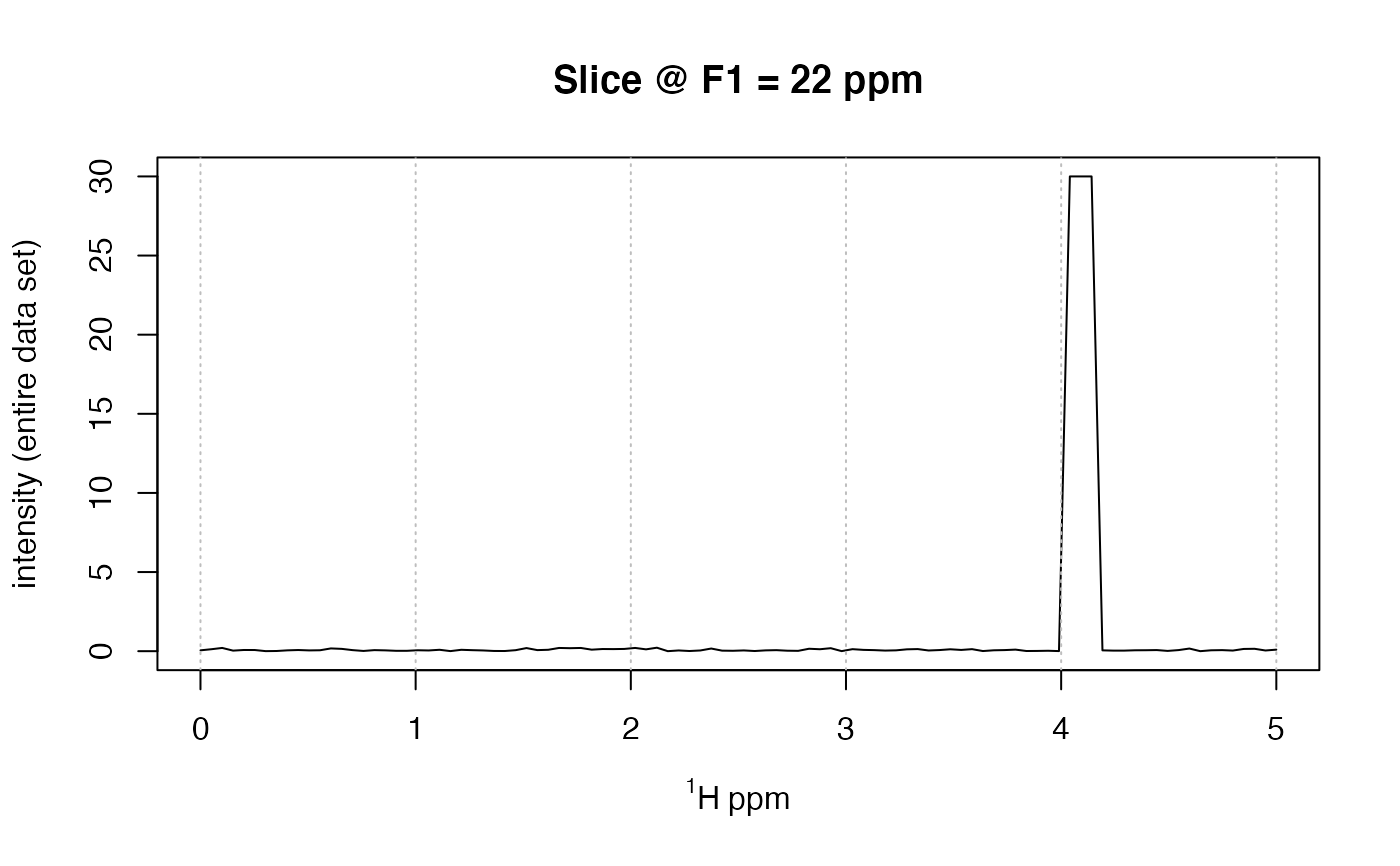
Plots a slice of a 2D spectrum stored in a Spectra2D object.
plotSlice(spectra, which = 1, F2 = NULL, F1 = NULL, showGrid = TRUE, ...)Arguments
- spectra
An object of S3 class
Spectra2D.- which
A single integer specifying which 2D spectrum from which to plot the slice.
- F2
A single frequency to plot. Matched to the nearest value.
- F1
As for
F2.- showGrid
Logical. If TRUE, show a dotted gray line at each x axis tick mark.
- ...
Additional parameters to be passed to the plotting routines.
Value
Side effect is a plot.
Note
Only one of F2 or F1 should be given.
Examples
data(MUD1)
plotSlice(MUD1, F1 = 22, main = "Slice @ F1 = 22 ppm")
