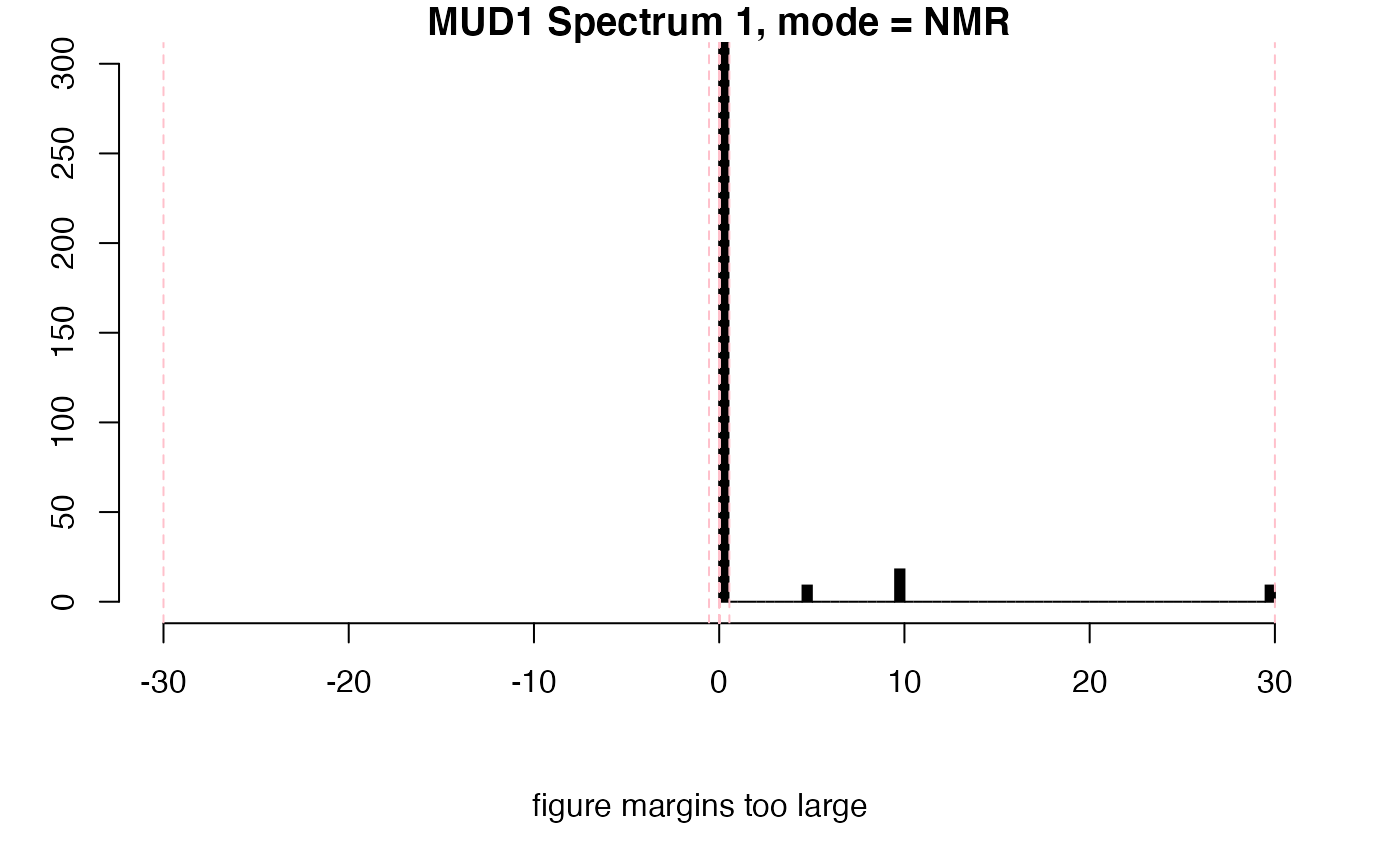
Given a Spectra2D object, this function will assist in selecting levels for preparing contour and image type plots. Any of the arguments to calcLvls can be used to compute the levels, or you can choose your own by inspection.

inspectLvls(spectra, which = 1, ...)

Arguments

spectra

An object of S3 class Spectra2D.

which

Integer. The spectrum/spectra to be analyzed. If a vector, the intensities are combined.

...

Arguments to be passed downstream to calcLvls and/or the plot function (e.g. ylim).

Value

A numeric vector giving the levels (invisibly).

See also

See pfacSpectra2D for further examples.

Author

Bryan A. Hanson, DePauw University. hanson@depauw.edu

Examples

data(MUD1) inspectLvls(MUD1, ylim = c(0, 300), main = "MUD1 Spectrum 1, mode = even")
inspectLvls(MUD1, ylim = c(0, 300), mode = "NMR", main = "MUD1 Spectrum 1, mode = NMR")