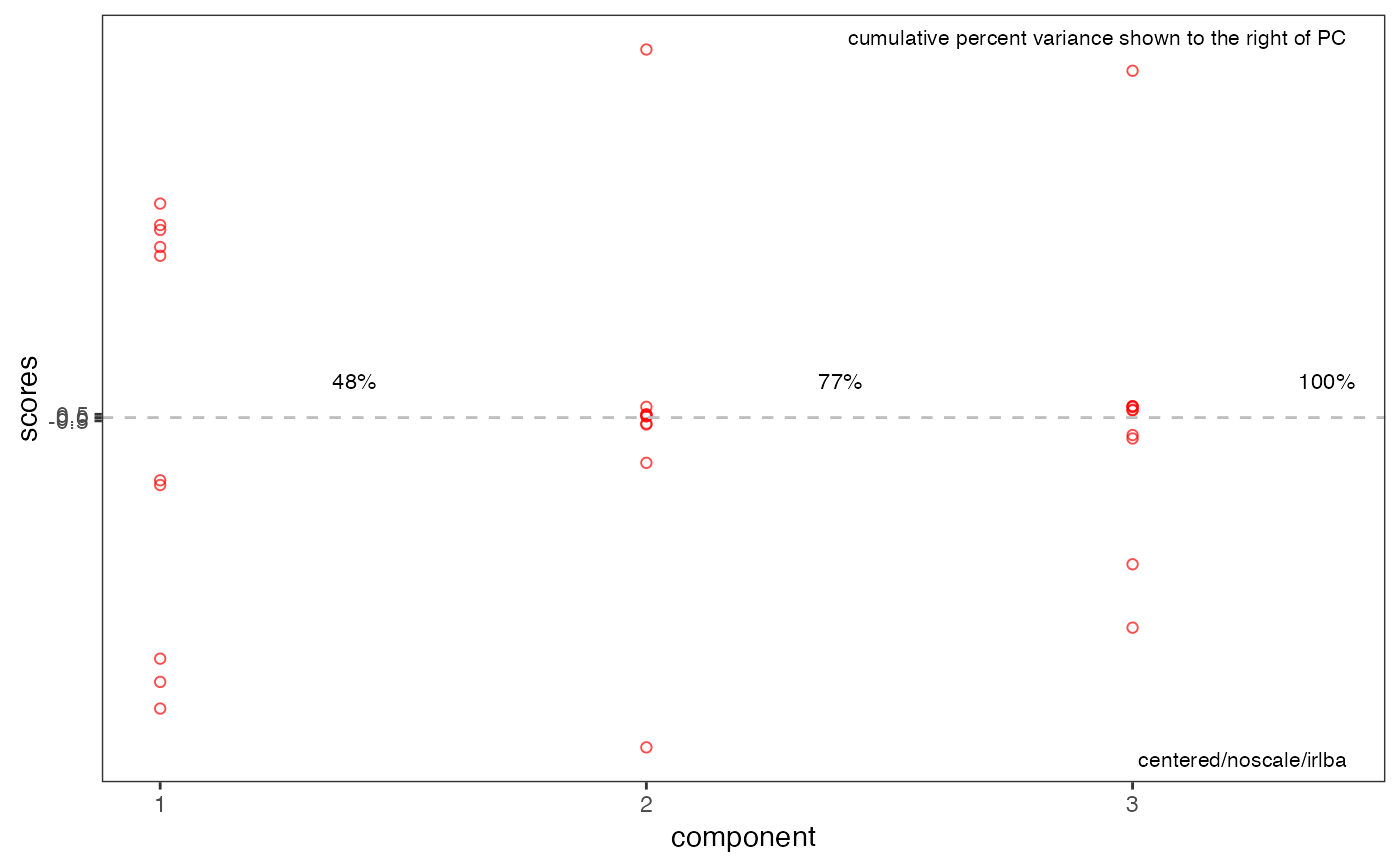
This function unstacks a Spectra2D
object and conducts IRLBA
PCA on it.
To unstack, each F1 slice (parallel to F2) is concatenated one after the other
so that each 2D spectrum becomes a 1D spectrum. The length of this spectrum will be
equal to the length of the F2 dimension times the length of the F1 dimension.
PCA is performed on the collection of 1D spectra (one spectrum from each 2D spectrum).
The IRLBA algorithm is used because the resulting matrix (n samples in rows x F1 * F2 columns)
can be very large, and other PCA algorithms can struggle.
popSpectra2D(spectra, n = 3, choice = "noscale", ...)
spectra | An object of S3 class |
---|---|
n | Integer. The number of components desired. |
choice | A character string indicating the choice of scaling. One of
|
... | Other parameters to be passed to |
An object of classes prcomp
, pop
and computed_via_irlba
modified to include a list element called $method
, a character string describing the
pre-processing carried out and the type of PCA performed (used to annotate
plots).
The scale choice autoscale
scales the columns by their standard
deviation. Pareto
scales by the square root of the standard
deviation. "autoscale"
is called "standard normal variate" or "correlation matrix PCA"
in some literature. This action is performed on the unstacked matrix, as is centering.
J. Baglama and L. Reichel, "Augmented Implicitly Restarted Lanczos Bidiagonalization Methods" SIAM J. Sci. Comput. (2005).
For other data reduction methods for Spectra2D
objects, see
miaSpectra2D
and pfacSpectra2D
.
Bryan A. Hanson, DePauw University.
library("ggplot2") data(MUD1) res <- popSpectra2D(MUD1) # plotScores & plotScree use ggplot2 graphics p1 <- plotScores(MUD1, res, ellipse = "cls")#> Error in (function (spectra, so, pcs = c(1, 2), ellipse = "none", tol = "none", use.sym = FALSE, leg.loc = "topright", ...) { args <- as.list(match.call())[-1] if (length(pcs) != 2) stop("You must choose exactly two PC's to plot") case <- NULL if (inherits(spectra, "Spectra")) case <- "PCA" if (inherits(spectra, "Spectra2D")) case <- "MIA" if (inherits(so, "pop")) case <- "PCA" if (is.null(case)) stop("Could not reconcile data object and scores object.") if ((case == "MIA") && (use.sym)) stop("ChemoSpec2D does not support use.sym") chkSpectra(spectra) if (case == "PCA") DF <- data.frame(so$x[, pcs], group = spectra$groups) if (case == "MIA") DF <- data.frame(so$C[, pcs], group = spectra$groups) GRPS <- dlply(DF, "group", subset, select = c(1, 2)) if ((ellipse == "cls") || (ellipse == "rob") || (ellipse == "both")) { gr <- sumGroups(spectra) for (n in 1:length(gr$group)) { if (gr$no.[n] == 1) message("Group ", gr$group[n], "\n\thas only 1 member (no ellipse possible)") if (gr$no.[n] == 2) message("Group ", gr$group[n], "\n\thas only 2 members (no ellipse possible)") if (gr$no.[n] == 3) message("Group ", gr$group[n], "\n\thas only 3 members (ellipse not drawn)") } idx <- which(gr$no. > 3) gr <- gr[idx, ] ELL <- llply(GRPS[idx], .computeEllipses) } go <- chkGraphicsOpt() if (go == "base") { if ((ellipse == "cls") || (ellipse == "rob") || (ellipse == "both")) { x.scores <- range(llply(GRPS, subset, select = 1)) y.scores <- range(llply(GRPS, subset, select = 2)) x.ell <- range(llply(ELL, function(x) { range(x[1]) })) y.ell <- range(llply(ELL, function(x) { range(x[2]) })) x.ell.r <- range(llply(ELL, function(x) { range(x[4]) })) y.ell.r <- range(llply(ELL, function(x) { range(x[5]) })) x.all <- range(x.scores, x.ell, x.ell.r) x.all <- x.all + diff(x.all) * 0.05 * c(-1, 1.15) y.all <- range(y.scores, y.ell, y.ell.r) y.all <- y.all + diff(x.all) * 0.05 * c(-1, 1.15) } if (ellipse == "none") { x.scores <- range(llply(GRPS, subset, select = 1)) y.scores <- range(llply(GRPS, subset, select = 2)) x.all <- range(x.scores) + diff(range(x.scores)) * 0.05 * c(-1, 1.15) y.all <- range(y.scores) + diff(range(y.scores)) * 0.05 * c(-1, 1.15) } dPargs <- list(PCs = DF[, 1:2], spectra = spectra, case = case, use.sym = use.sym, ... = ...) if (!"xlim" %in% names(args)) dPargs <- c(dPargs, list(xlim = x.all)) if (!"ylim" %in% names(args)) dPargs <- c(dPargs, list(ylim = y.all)) do.call(.drawPoints, dPargs) if ((ellipse == "cls") | (ellipse == "rob") | (ellipse == "both")) .drawEllipses(ELL, gr, ellipse, use.sym, ...) if (case == "PCA") { .addMethod(so) if (all(leg.loc != "none")) { leg.loc <- .prepLegendCoords(go, leg.loc, x.all[1], x.all[2], y.all[1], y.all[2]) .addLegend(spectra, leg.loc, use.sym, bty = "n") } .addEllipseInfo(ellipse) } if (case == "MIA") { if (all(leg.loc != "none")) { leg.loc <- .prepLegendCoords(go, leg.loc, x.all[1], x.all[2], y.all[1], y.all[2]) .addLegend(spectra, leg.loc, use.sym = FALSE, bty = "n") } .addEllipseInfo(ellipse) } if (tol != "none") .labelExtremes(DF[, 1:2], spectra$names, tol) } if ((go == "ggplot2") || (go == "plotly")) { args <- as.list(match.call()[-1]) xlab <- eval(args$xlab) ylab <- eval(args$ylab) .chkReqGraphicsPkgs("ggplot2") x <- y <- name <- label <- NULL if (case == "PCA") { if (!use.sym) { p <- ggplot(DF) + geom_point(aes_string(x = colnames(DF)[1], y = colnames(DF)[2]), color = spectra$colors, shape = 20, size = 3) + labs(x = xlab, y = ylab) } if (use.sym) { p <- ggplot(DF) + geom_point(aes_string(x = colnames(DF)[1], y = colnames(DF)[2]), color = "black", shape = spectra$sym) + labs(x = xlab, y = ylab) } if (go == "ggplot2") { p <- p + .ggAnnotate(so$method, x = 0.05, y = 0.98, just = "left", gp = gpar(fontsize = 8)) } } if (case == "MIA") { p <- ggplot(DF) + geom_point(aes_string(x = colnames(DF)[1], y = colnames(DF)[2]), color = spectra$colors, shape = 20, size = 3) } p <- p + theme_bw() + theme(panel.grid.major = element_blank(), panel.grid.minor = element_blank()) if ((ellipse == "cls") | (ellipse == "rob") | (ellipse == "both")) { .ggPrepEllipseCoords <- function(data) { df <- data.frame(x = numeric(), y = numeric(), name = character()) for (i in 1:length(data)) { x <- c() y <- c() name <- c() total <- length(data[[i]])/2 for (j in 1:total) { x <- c(x, data[[i]][j, 1]) y <- c(y, data[[i]][j, 2]) } name <- rep(names(data)[i], total) temp <- data.frame(x, y, name) df <- rbind(df, temp) } return(df) } } if (ellipse == "cls") { cls.coords <- llply(ELL, function(x) { x[1:2] }) cls.coords <- llply(cls.coords, function(x) { do.call(cbind, x) }) df.cls <- .ggPrepEllipseCoords(cls.coords) if (!use.sym) { p <- p + geom_path(data = df.cls, aes(x = x, y = y, color = name), linetype = 2) + scale_color_manual(values = gr$color) } if (use.sym) { color.black <- rep("black", length(gr$color)) p <- p + geom_path(data = df.cls, aes(x = x, y = y, color = name), linetype = 2) + scale_color_manual(values = color.black) } if (go == "ggplot2") { p <- p + .ggAnnotate("cls") } } if (ellipse == "rob") { rob.coords <- llply(ELL, function(x) { x[4:5] }) rob.coords <- llply(rob.coords, function(x) { do.call(cbind, x) }) df.rob <- .ggPrepEllipseCoords(rob.coords) if (!use.sym) { p <- p + geom_path(data = df.rob, aes(x = x, y = y, color = name)) + scale_color_manual(values = gr$color) } if (use.sym) { color.black <- rep("black", length(gr$color)) p <- p + geom_path(data = df.rob, aes(x = x, y = y, color = name)) + scale_color_manual(values = color.black) } if (go == "ggplot2") { p <- p + .ggAnnotate("rob") } } if (ellipse == "both") { cls.coords <- llply(ELL, function(x) { x[1:2] }) cls.coords <- llply(cls.coords, function(x) { do.call(cbind, x) }) df.cls <- .ggPrepEllipseCoords(cls.coords) rob.coords <- llply(ELL, function(x) { x[4:5] }) rob.coords <- llply(rob.coords, function(x) { do.call(cbind, x) }) df.rob <- .ggPrepEllipseCoords(rob.coords) if (!use.sym) { lines <- rep(2, length(gr$color)) p <- p + geom_path(data = df.cls, aes(x = x, y = y, color = name), linetype = 2) p <- p + geom_path(data = df.rob, aes(x = x, y = y, color = name)) + scale_color_manual(values = gr$color) } if (use.sym) { color.black <- rep("black", length(gr$color)) p <- p + geom_path(data = df.cls, aes(x = x, y = y, color = name)) p <- p + geom_path(data = df.rob, aes(x = x, y = y, color = name), linetype = 2) + scale_color_manual(values = color.black) } if (go == "ggplot2") { p <- p + .ggAnnotate("both") } } if (go == "ggplot2") { if (tol != "none") { CoordList <- .getExtremeCoords(DF[, 1:2], spectra$names, tol) df <- data.frame(x = CoordList$x, y = CoordList$y, label = CoordList$l) p <- p + .ggRepel(df) } p <- p + theme(legend.position = "none") if (all(leg.loc != "none")) { p <- p + .ggAddLegend(spectra, use.sym, leg.loc) } return(p) } else { .chkReqGraphicsPkgs("plotly") p <- ggplotly(p, tooltip = c(colnames(DF[1]), colnames(DF[2]), "name")) if (tol != "none") { CoordList <- .getExtremeCoords(DF[, 1:2], spectra$names, tol) df <- data.frame(x = CoordList$x, y = CoordList$y, label = CoordList$l) p <- p %>% add_annotations(x = df$x, y = df$y, text = df$label, xref = "x", yref = "y", showarrow = TRUE, arrowhead = 4, arrowsize = 0.5, ax = 40, ay = -25, font = list(size = 12)) } p <- p %>% layout(showlegend = FALSE) return(p) } }})(spectra = MUD1, so = res, ellipse = "cls", xlab = "Component 1 (47.64%)", ylab = "Component 2 (29.76%)", use.sym = FALSE): object 'res' not found#> Error in eval(expr, envir, enclos): object 'p1' not foundp1#> Error in eval(expr, envir, enclos): object 'p1' not found# plotLoadings2D uses base graphics MUD1a <- plotLoadings2D(MUD1, res, load_lvls = c(-0.2, -0.1, 0.1, 0.2), load_cols = rep("black", 4), main = "POP Comp. 1 Loadings")