Carry out multivariate image analysis of a Spectra2D object (multivariate image analysis is the same as a Tucker1 analysis). Function pcasup1 from package ThreeWay is used.

miaSpectra2D(spectra)

Arguments

spectra

An object of S3 class Spectra2D.

Value

A list per pcasup1. Of particular interest are the elements C containing the eigenvectors and 1c containing the eigenvalues. We add the class mia to the list for our use later, as well as a method element for annotating plots.

References

A. Smilde, R. Bro and P. Geladi "Multi-way Analysis: Applications in the Chemical Sciences" Wiley (2004). See especially Example 4.5.

P. Geladi and H. Grahn "Multivariate Image Analysis" Wiley (1996). Note that in this text the meanings of scores and loadings are reversed from the usual spectroscopic uses of the terms.

See also

For other data reduction methods for Spectra2D objects, see pfacSpectra2D and popSpectra2D.

Author

Bryan A. Hanson, DePauw University.

Examples

library("ggplot2") data(MUD1) res <- miaSpectra2D(MUD1)
#> PCASUP: eigenvalues mode C #> Eigenvalue Fit(%) #> Comp.1 92964.50 79.89 #> Comp.2 6995.23 85.90 #> Comp.3 5744.79 90.84 #> Comp.4 4342.95 94.57 #> Comp.5 2282.62 96.53 #> Comp.6 1959.07 98.22 #> Comp.7 1132.67 99.19 #> Comp.8 528.56 99.65 #> Comp.9 263.81 99.87 #> Comp.10 148.99 100.00
# plotScores & plotScree use ggplot2 graphics p1 <- plotScores(MUD1, res, tol = 1.0, ellipse = "cls")
#> Error in (function (spectra, so, pcs = c(1, 2), ellipse = "none", tol = "none", use.sym = FALSE, leg.loc = "topright", ...) { args <- as.list(match.call())[-1] if (length(pcs) != 2) stop("You must choose exactly two PC's to plot") case <- NULL if (inherits(spectra, "Spectra")) case <- "PCA" if (inherits(spectra, "Spectra2D")) case <- "MIA" if (inherits(so, "pop")) case <- "PCA" if (is.null(case)) stop("Could not reconcile data object and scores object.") if ((case == "MIA") && (use.sym)) stop("ChemoSpec2D does not support use.sym") chkSpectra(spectra) if (case == "PCA") DF <- data.frame(so$x[, pcs], group = spectra$groups) if (case == "MIA") DF <- data.frame(so$C[, pcs], group = spectra$groups) GRPS <- dlply(DF, "group", subset, select = c(1, 2)) if ((ellipse == "cls") || (ellipse == "rob") || (ellipse == "both")) { gr <- sumGroups(spectra) for (n in 1:length(gr$group)) { if (gr$no.[n] == 1) message("Group ", gr$group[n], "\n\thas only 1 member (no ellipse possible)") if (gr$no.[n] == 2) message("Group ", gr$group[n], "\n\thas only 2 members (no ellipse possible)") if (gr$no.[n] == 3) message("Group ", gr$group[n], "\n\thas only 3 members (ellipse not drawn)") } idx <- which(gr$no. > 3) gr <- gr[idx, ] ELL <- llply(GRPS[idx], .computeEllipses) } go <- chkGraphicsOpt() if (go == "base") { if ((ellipse == "cls") || (ellipse == "rob") || (ellipse == "both")) { x.scores <- range(llply(GRPS, subset, select = 1)) y.scores <- range(llply(GRPS, subset, select = 2)) x.ell <- range(llply(ELL, function(x) { range(x[1]) })) y.ell <- range(llply(ELL, function(x) { range(x[2]) })) x.ell.r <- range(llply(ELL, function(x) { range(x[4]) })) y.ell.r <- range(llply(ELL, function(x) { range(x[5]) })) x.all <- range(x.scores, x.ell, x.ell.r) x.all <- x.all + diff(x.all) * 0.05 * c(-1, 1.15) y.all <- range(y.scores, y.ell, y.ell.r) y.all <- y.all + diff(x.all) * 0.05 * c(-1, 1.15) } if (ellipse == "none") { x.scores <- range(llply(GRPS, subset, select = 1)) y.scores <- range(llply(GRPS, subset, select = 2)) x.all <- range(x.scores) + diff(range(x.scores)) * 0.05 * c(-1, 1.15) y.all <- range(y.scores) + diff(range(y.scores)) * 0.05 * c(-1, 1.15) } dPargs <- list(PCs = DF[, 1:2], spectra = spectra, case = case, use.sym = use.sym, ... = ...) if (!"xlim" %in% names(args)) dPargs <- c(dPargs, list(xlim = x.all)) if (!"ylim" %in% names(args)) dPargs <- c(dPargs, list(ylim = y.all)) do.call(.drawPoints, dPargs) if ((ellipse == "cls") | (ellipse == "rob") | (ellipse == "both")) .drawEllipses(ELL, gr, ellipse, use.sym, ...) if (case == "PCA") { .addMethod(so) if (all(leg.loc != "none")) { leg.loc <- .prepLegendCoords(go, leg.loc, x.all[1], x.all[2], y.all[1], y.all[2]) .addLegend(spectra, leg.loc, use.sym, bty = "n") } .addEllipseInfo(ellipse) } if (case == "MIA") { if (all(leg.loc != "none")) { leg.loc <- .prepLegendCoords(go, leg.loc, x.all[1], x.all[2], y.all[1], y.all[2]) .addLegend(spectra, leg.loc, use.sym = FALSE, bty = "n") } .addEllipseInfo(ellipse) } if (tol != "none") .labelExtremes(DF[, 1:2], spectra$names, tol) } if ((go == "ggplot2") || (go == "plotly")) { args <- as.list(match.call()[-1]) xlab <- eval(args$xlab) ylab <- eval(args$ylab) .chkReqGraphicsPkgs("ggplot2") x <- y <- name <- label <- NULL if (case == "PCA") { if (!use.sym) { p <- ggplot(DF) + geom_point(aes_string(x = colnames(DF)[1], y = colnames(DF)[2]), color = spectra$colors, shape = 20, size = 3) + labs(x = xlab, y = ylab) } if (use.sym) { p <- ggplot(DF) + geom_point(aes_string(x = colnames(DF)[1], y = colnames(DF)[2]), color = "black", shape = spectra$sym) + labs(x = xlab, y = ylab) } if (go == "ggplot2") { p <- p + .ggAnnotate(so$method, x = 0.05, y = 0.98, just = "left", gp = gpar(fontsize = 8)) } } if (case == "MIA") { p <- ggplot(DF) + geom_point(aes_string(x = colnames(DF)[1], y = colnames(DF)[2]), color = spectra$colors, shape = 20, size = 3) } p <- p + theme_bw() + theme(panel.grid.major = element_blank(), panel.grid.minor = element_blank()) if ((ellipse == "cls") | (ellipse == "rob") | (ellipse == "both")) { .ggPrepEllipseCoords <- function(data) { df <- data.frame(x = numeric(), y = numeric(), name = character()) for (i in 1:length(data)) { x <- c() y <- c() name <- c() total <- length(data[[i]])/2 for (j in 1:total) { x <- c(x, data[[i]][j, 1]) y <- c(y, data[[i]][j, 2]) } name <- rep(names(data)[i], total) temp <- data.frame(x, y, name) df <- rbind(df, temp) } return(df) } } if (ellipse == "cls") { cls.coords <- llply(ELL, function(x) { x[1:2] }) cls.coords <- llply(cls.coords, function(x) { do.call(cbind, x) }) df.cls <- .ggPrepEllipseCoords(cls.coords) if (!use.sym) { p <- p + geom_path(data = df.cls, aes(x = x, y = y, color = name), linetype = 2) + scale_color_manual(values = gr$color) } if (use.sym) { color.black <- rep("black", length(gr$color)) p <- p + geom_path(data = df.cls, aes(x = x, y = y, color = name), linetype = 2) + scale_color_manual(values = color.black) } if (go == "ggplot2") { p <- p + .ggAnnotate("cls") } } if (ellipse == "rob") { rob.coords <- llply(ELL, function(x) { x[4:5] }) rob.coords <- llply(rob.coords, function(x) { do.call(cbind, x) }) df.rob <- .ggPrepEllipseCoords(rob.coords) if (!use.sym) { p <- p + geom_path(data = df.rob, aes(x = x, y = y, color = name)) + scale_color_manual(values = gr$color) } if (use.sym) { color.black <- rep("black", length(gr$color)) p <- p + geom_path(data = df.rob, aes(x = x, y = y, color = name)) + scale_color_manual(values = color.black) } if (go == "ggplot2") { p <- p + .ggAnnotate("rob") } } if (ellipse == "both") { cls.coords <- llply(ELL, function(x) { x[1:2] }) cls.coords <- llply(cls.coords, function(x) { do.call(cbind, x) }) df.cls <- .ggPrepEllipseCoords(cls.coords) rob.coords <- llply(ELL, function(x) { x[4:5] }) rob.coords <- llply(rob.coords, function(x) { do.call(cbind, x) }) df.rob <- .ggPrepEllipseCoords(rob.coords) if (!use.sym) { lines <- rep(2, length(gr$color)) p <- p + geom_path(data = df.cls, aes(x = x, y = y, color = name), linetype = 2) p <- p + geom_path(data = df.rob, aes(x = x, y = y, color = name)) + scale_color_manual(values = gr$color) } if (use.sym) { color.black <- rep("black", length(gr$color)) p <- p + geom_path(data = df.cls, aes(x = x, y = y, color = name)) p <- p + geom_path(data = df.rob, aes(x = x, y = y, color = name), linetype = 2) + scale_color_manual(values = color.black) } if (go == "ggplot2") { p <- p + .ggAnnotate("both") } } if (go == "ggplot2") { if (tol != "none") { CoordList <- .getExtremeCoords(DF[, 1:2], spectra$names, tol) df <- data.frame(x = CoordList$x, y = CoordList$y, label = CoordList$l) p <- p + .ggRepel(df) } p <- p + theme(legend.position = "none") if (all(leg.loc != "none")) { p <- p + .ggAddLegend(spectra, use.sym, leg.loc) } return(p) } else { .chkReqGraphicsPkgs("plotly") p <- ggplotly(p, tooltip = c(colnames(DF[1]), colnames(DF[2]), "name")) if (tol != "none") { CoordList <- .getExtremeCoords(DF[, 1:2], spectra$names, tol) df <- data.frame(x = CoordList$x, y = CoordList$y, label = CoordList$l) p <- p %>% add_annotations(x = df$x, y = df$y, text = df$label, xref = "x", yref = "y", showarrow = TRUE, arrowhead = 4, arrowsize = 0.5, ax = 40, ay = -25, font = list(size = 12)) } p <- p %>% layout(showlegend = FALSE) return(p) } }})(spectra = MUD1, so = res, ellipse = "cls", tol = 1, xlab = "Component 1 (79.89%)", ylab = "Component 2 (6.01%)", use.sym = FALSE): object 'res' not found
p1 <- p1 + ggtitle("MIA Scores")
#> Error in eval(expr, envir, enclos): object 'p1' not found
p1
#> Error in eval(expr, envir, enclos): object 'p1' not found
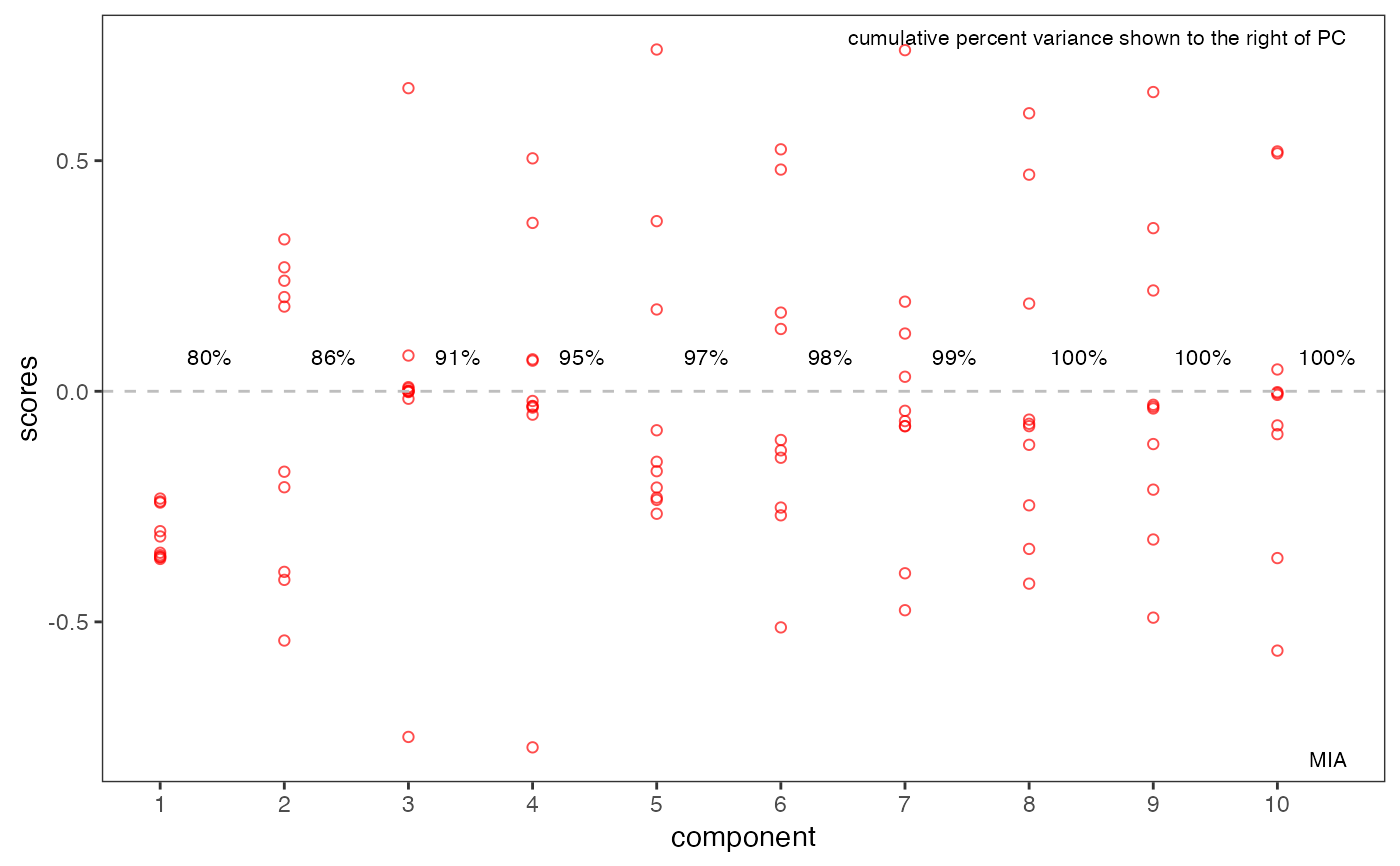
p2 <- plotScree(res)
#> Scale for 'x' is already present. Adding another scale for 'x', which will #> replace the existing scale.
p2
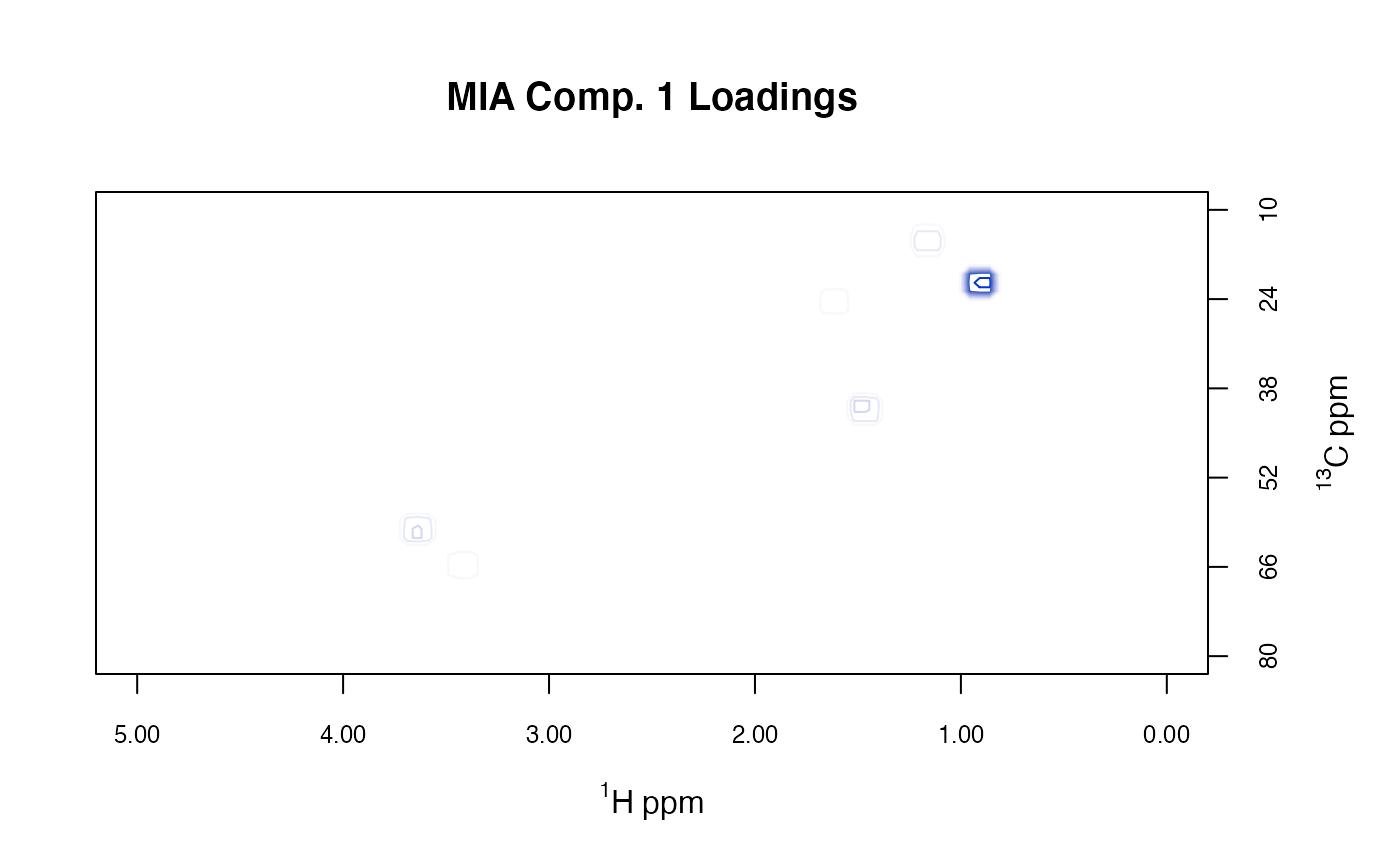
# plotLoadings2D uses base graphics MUD1a <- plotLoadings2D(MUD1, res, load_lvls = seq(-90, 0, 10), main = "MIA Comp. 1 Loadings" )
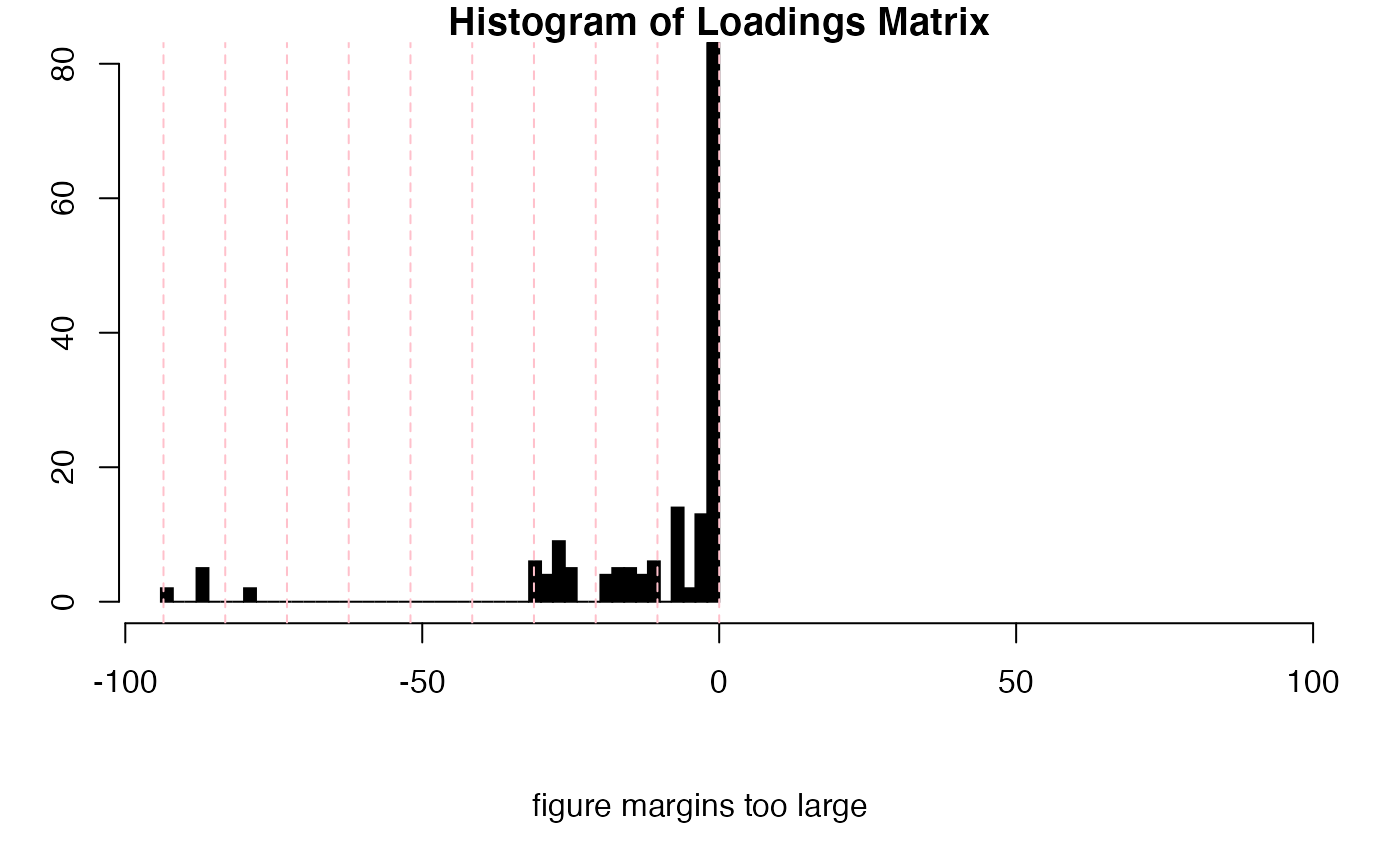
# Selection of loading matrix levels can be aided by the following # Use MUD1a$names to find the index of the loadings inspectLvls(MUD1a, which = 11, ylim = c(0, 80), main = "Histogram of Loadings Matrix" )