Plots a 2D spectrum stored in a Spectra2D object.
This is primarily for inspection and for preparation of final plots.
If you need to do extensive exploration, you should probably go back
to the spectrometer.
plotSpectra2D(
  spectra,
  which = 1,
  lvls = NULL,
  cols = NULL,
  showNA = TRUE,
  showGrid = FALSE,
  ...
)
Arguments
- spectra
An object of S3 class
Spectra2D.- which
An integer specifying which spectrum to plot. May be a vector.
- lvls
A numeric vector specifying the levels at which to compute contours. If
NULL, values are computed usingcalcLvls. If argumentwhichgives more than one spectrum to plot, thenlvlsmust be a list of levels oflength(which).- cols
A vector of valid color designations. If provided, must be of the the same length as
lvls(i.e. each contour is a particular color). IfNULL, defaults to using a scheme of up to nine values running from blue (low) to red (high), centered on green (zero). If argumentwhichgives more than one spectrum to plot, thencolsmust be a list of colors oflength(which).- showNA
Logical. Should the locations of peaks removed by
removePeaks2Dbe shown? If present, these are shown by a gray line at each frequency.- showGrid
Logical. If TRUE, show a dotted gray line at each tick mark.
- ...
Additional parameters to be passed to the plotting routines.
Value
Side effect is a plot.
Warning
One cannot remove frequencies from the interior of a 2D NMR data set and expect to get a meaningful contour plot, because doing so puts unrelated peaks adjacent in the data set. This would lead to contours being drawn that don't exist in the original data set. This function will check for missing frequencies and stops if any are found.
Scale
You can view the color scale for the plot via showScale.
Levels & Colors
The number of levels and colors must match, and they are used 1 for 1. If you
provide n colors, and no levels, the automatic calculation of levels may return
a number of levels other than n, in which case the function will override your colors and
assign new colors for the number of levels it computed (with a message). To get
exactly what you want, specify both levels and colors in equal numbers. Function
inspectLvls can help you choose appropriate levels.
Overlaying Spectra
If you specify more than one spectrum to plot, e.g. which = c(1,2), then
arguments lvls and cols must be lists of levels and colors, one list
element for each spectrum to be plotted (if specified at all). Two convenience functions exist to
make this process easier: LofL and LofC. See the examples.
Examples
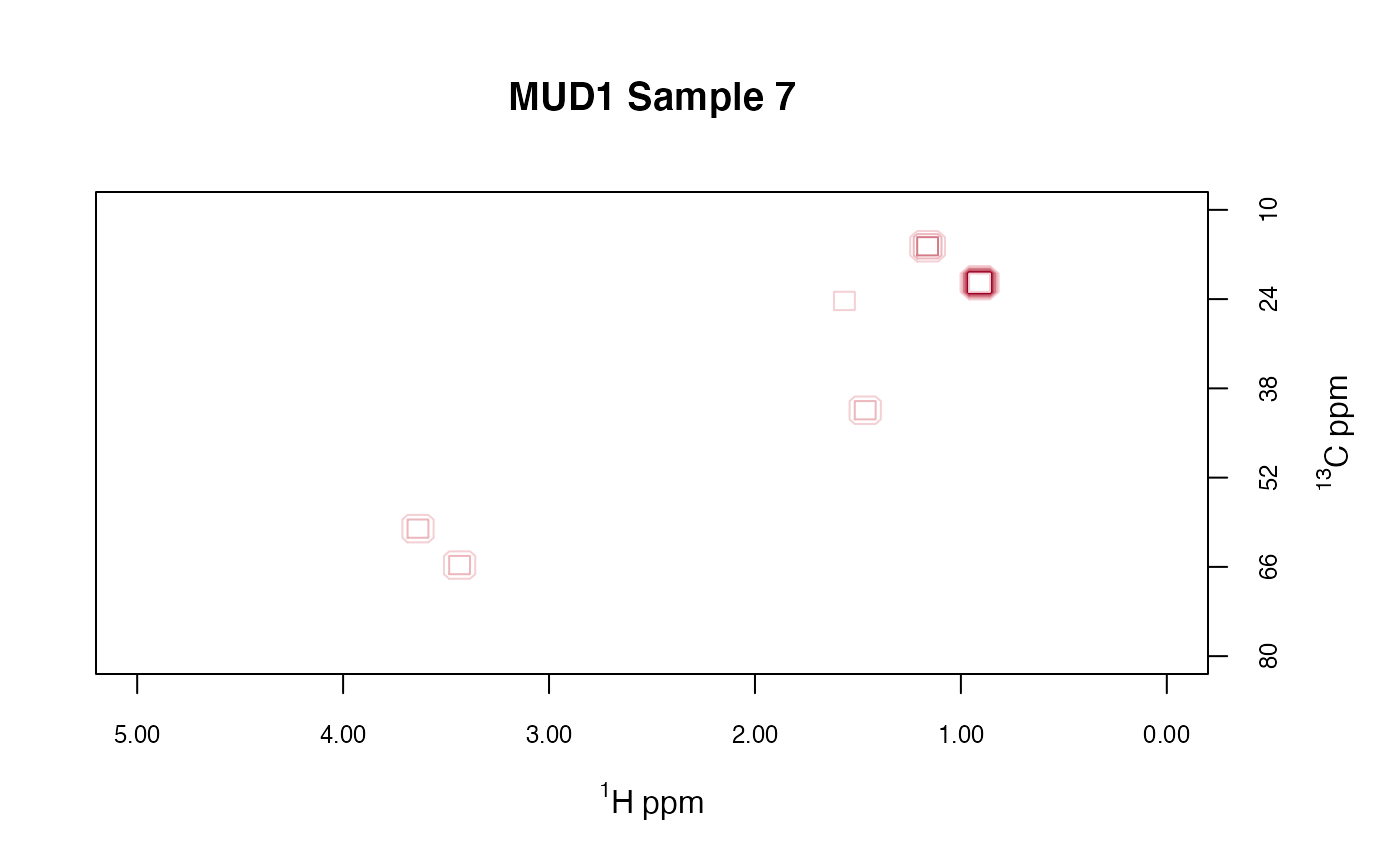
data(MUD1)
mylvls <- seq(5, 30, 5)
plotSpectra2D(MUD1,
  which = 7, lvls = mylvls,
  main = "MUD1 Sample 7"
)


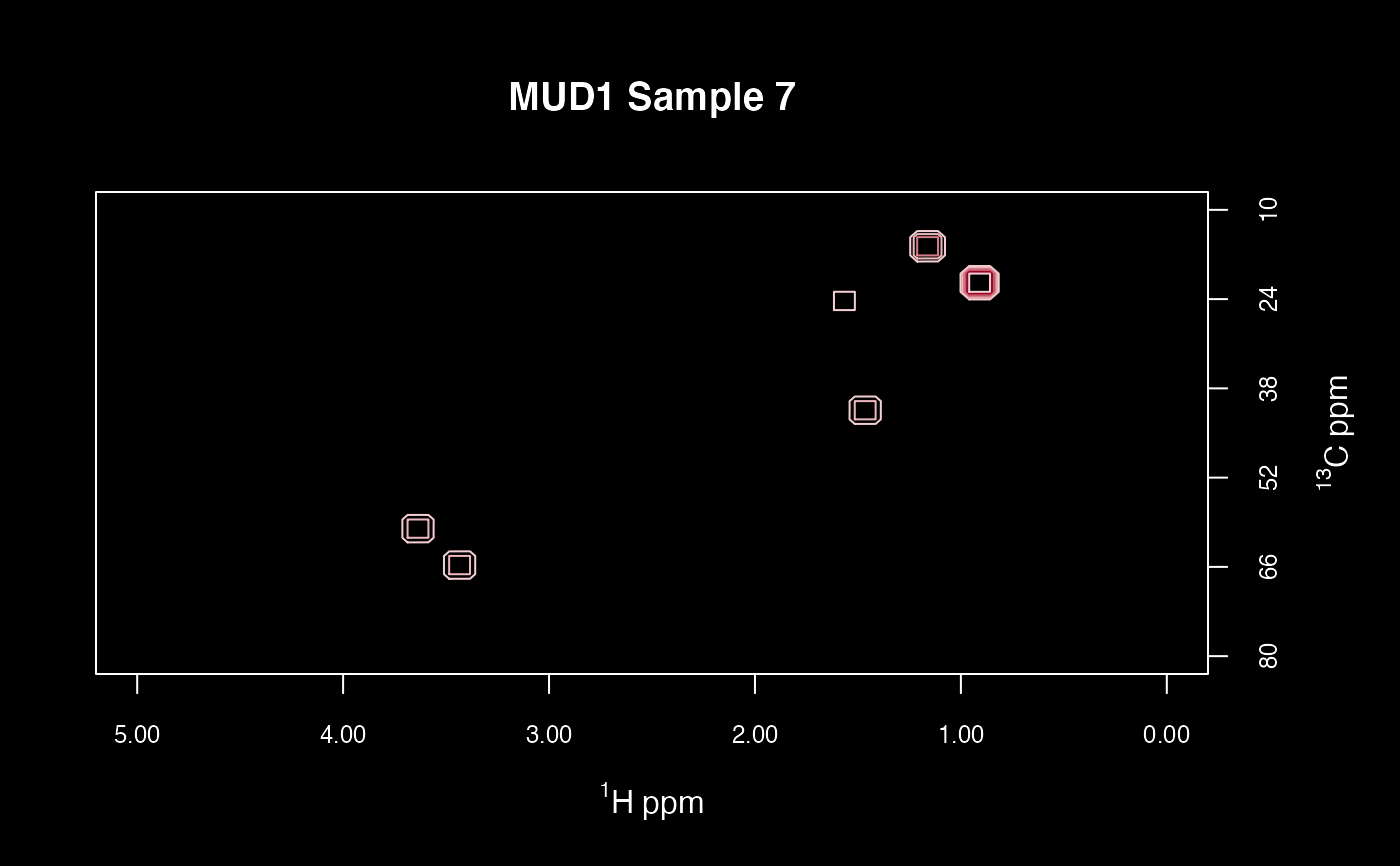
# Invert the screen which makes the colors pop!
op <- par(no.readonly = TRUE)
par(bg = "black", fg = "white", col.axis = "white", col.main = "white")
plotSpectra2D(MUD1,
  which = 7, lvls = mylvls,
  main = "MUD1 Sample 7"
)

par(op)

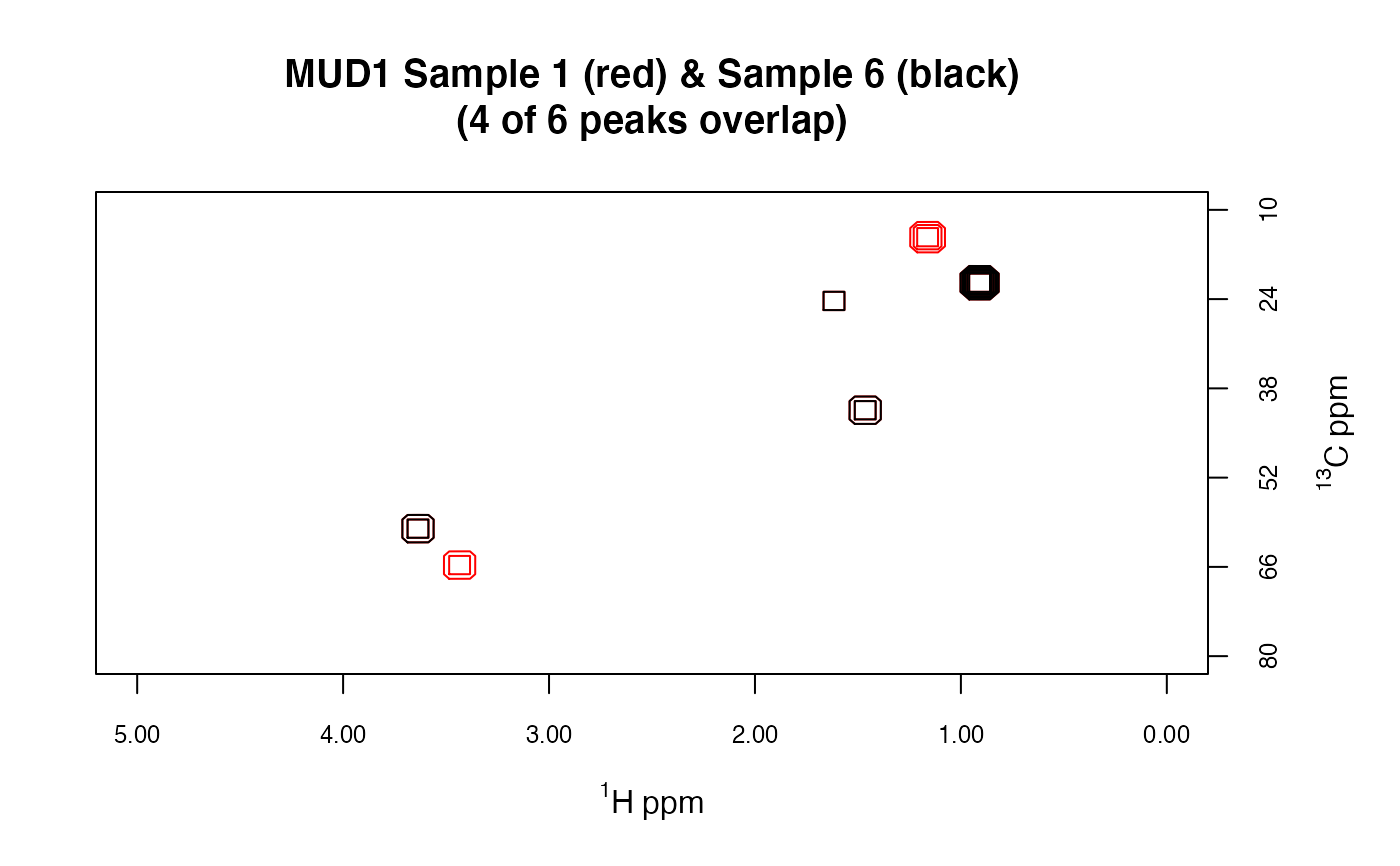
# Overlay multiple spectra:

plotSpectra2D(MUD1,
  which = c(6, 1), lvls = LofL(mylvls, 2),
  cols = LofC(c("red", "black"), 2, length(mylvls), 2),
  main = "MUD1 Sample 1 (red) & Sample 6 (black)\n(4 of 6 peaks overlap)"
)
